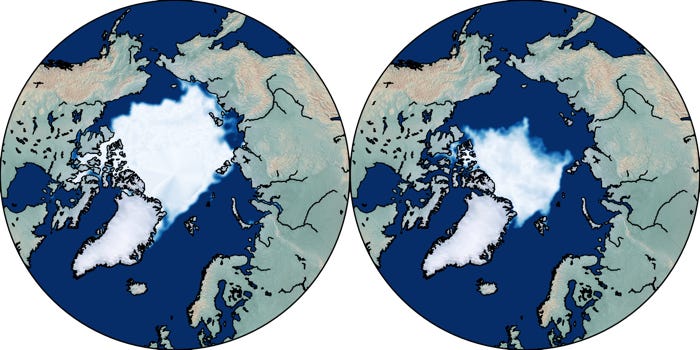
Permafrost Melting — The role of permafrost in the Climate System.
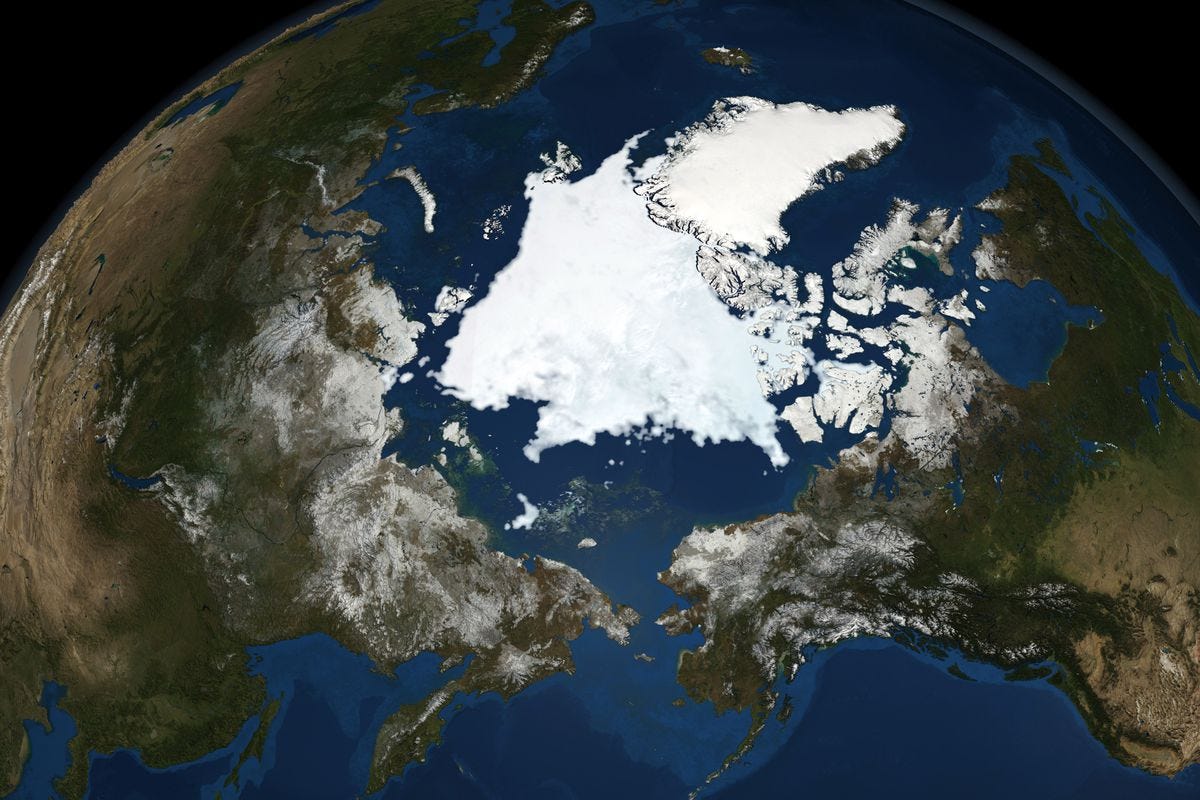
Do you remember when the “Northwest Passage” opened for the FIRST time in human history?
You should, it was 2007.
Arctic melt opens Northwest passage - Record low for sea-ice retreat.
Published 19 September 2007 | Nature 449, 267 (2007) | doi:10.1038/449267b
The most direct shipping route between the Atlantic and Pacific oceans, connecting Asia and Europe, is fully navigable for the first time since records began, data show. Warming has led to a record retreat of Arctic sea ice, which covers about 16 million square kilometers during March each year and melts to a minimum sometime in September or October.
In 2007 the Intergovernmental Panel on Climate Change predicted “that if current trends continue, a summer without sea ice will occur in the next 40 to 100 years”.
Or, it could happen “sooner”.
Arctic summer sea ice could disappear as early as 2035 - 2020
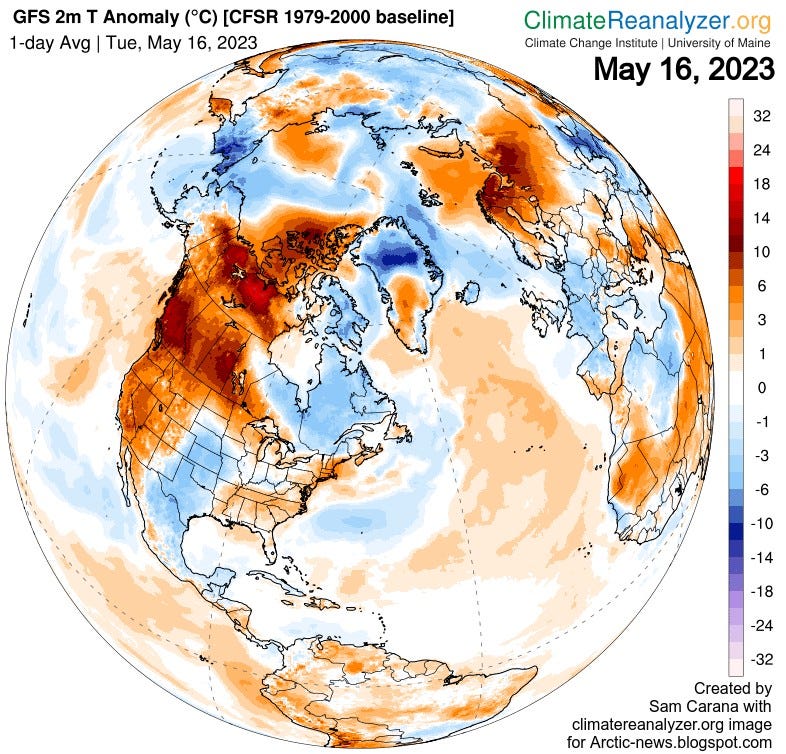
Because the Arctic is warming a LOT faster than the rest of the Earth.
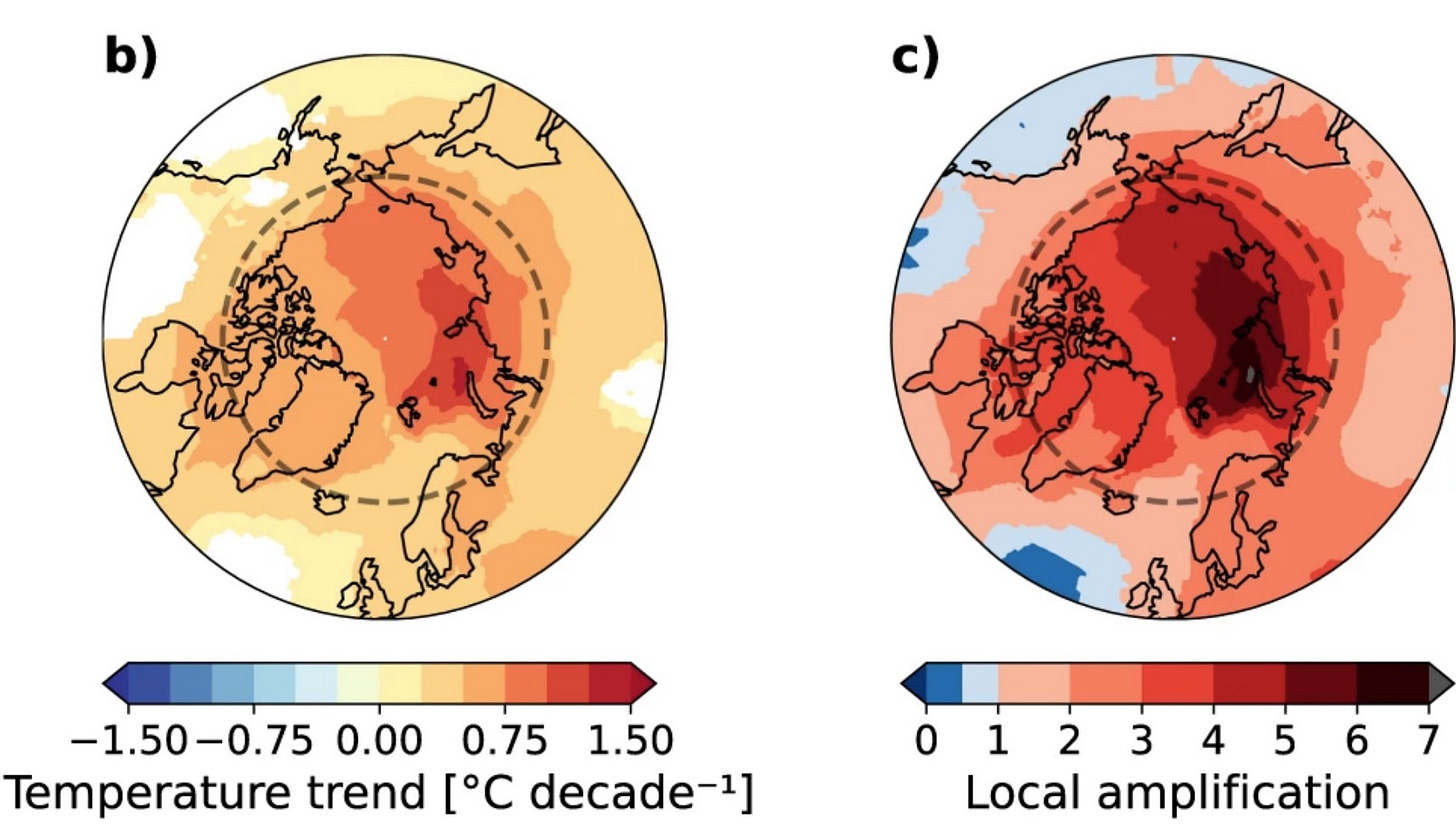
The Arctic has warmed nearly four times faster than the globe since 1979
Communications Earth & Environment volume 3, Article number: 168 (Aug 2022)
This is due to “Arctic Amplification” - It’s IMPORTANT because it tells us a LOT about how the Climate System actually works.
If you haven't read the first two parts of this short Climate System Users Guide you might want to take a look at them if you want all the details.
The Earth’s Climate System - A Short Users Guide. Part 01
Arctic Sea Ice is the “temperature gauge” of the Earth.

The Earth’s Climate System - A Short Users Guide. Part 02
Arctic Amplification — Understanding why the Polar Zones are warming 4X faster than the rest of the planet.
Because, the polar zones are warming 4X to 7X faster than the rest of the planet. Analysis of decades of datasets makes that really clear.
This is the Earth’s Climate System stripped down to it's most basic level.
The Earth’s Climate System is not that hard to understand, it’s about Heat.
HEAT enters at the Equator—→HEAT flows to the poles—→HEAT exits into space.
The Difference between the Amount of HEAT that enters the system each year and the Amount of HEAT that leaves it, is basically the amount of heat energy “in the system” that translates into the Global Mean Temperature, weather, and climate.
That's the Climate System stripped down to it’s most basic level.
The Climate System is about HEAT. Where it comes from, how it flows, where it goes, and what happens when it gets there.
If you want to understand the Climate System, “follow the HEAT”.
We know, that 80% of the Energy that the Earth captures from the Sun starts at the Equator.
We know, that this Energy moves through the oceans and the atmosphere FROM the equator towards the two poles.
We know, that as it moves from the Equator to the Poles some of this energy is lost.
We know, that the ENERGY that's left, winds up at one of the Poles.
We know, that ENERGY bleeds out of the Climate System during the Polar Winter.
WHAT WE DID NOT KNOW, during the 70’s, 80’s, and 90’s when we decided it was probably safe to keep burning fossil fuels. Was if the Poles would "eat" the extra ENERGY flowing from the Equator or if there would be "heat buildup".
NOW WE KNOW.
Areas of the Arctic Polar Zone have warmed as much as +7C since 1979. Most of it has warmed +3C to +4C.
+1C of warming at the Equator is resulting in +4C to +7C in the Arctic. Because, the effect of ACCUMULATION, is the AMPLIFICATION of INPUTS.
This knowledge allows us to understand the Climate System more deeply and to see how it works more completely.
Let's talk about that.
A NEW understanding of the Northern Climate System and its implications for the coming decades.
Here are the basics of what we have learned since 1958 (the Geophysical Year declared by the UN that marks the start of “Climate Science”).
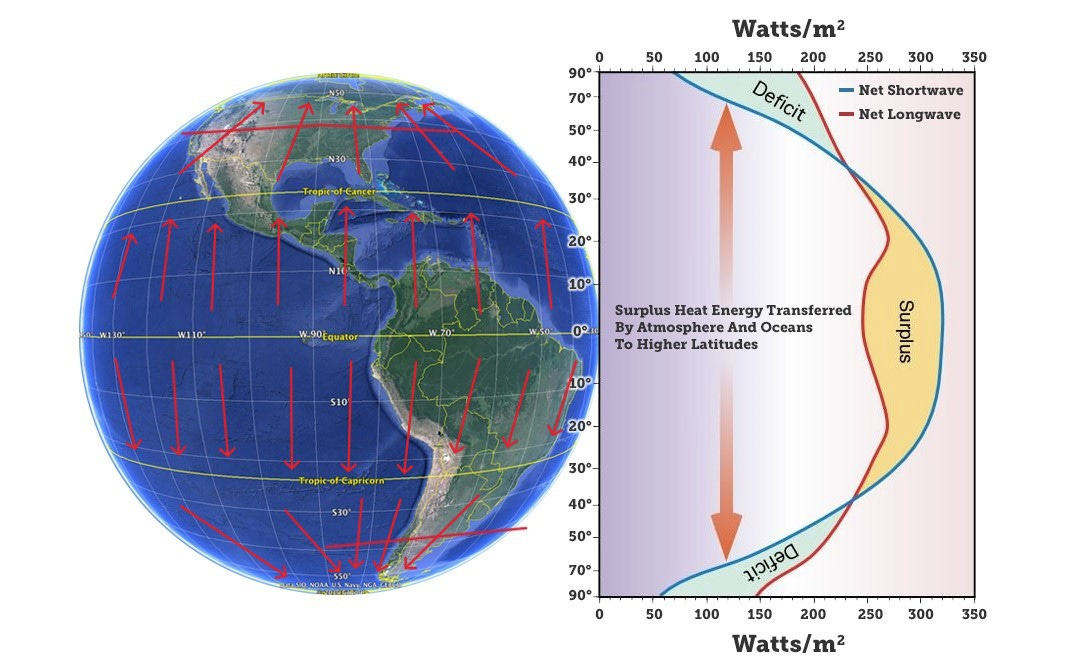
HEAT enters at the Equator—→HEAT flows to the poles—→HEAT exits into space.
In the Northern Hemisphere, this flow of HEAT can be visualized like this.

This is the Northern Hemisphere (NH) "Equator to Pole Temperature Gradient Curve".
This curve is NOT the same for the North Pole and the South Pole. Because of the difference in the amounts of land in each hemisphere, they process the ENERGY from the Equator differently. The South Pole is MUCH colder than the North Pole.
The NP Gradient from 1950-1980 was roughly -45C. -Meaning that if it was +25C (77F) at the Equator, you would expect it to be around -20C (-4F) at the North Pole.
The SP Gradient from 1950-1980 was roughly -80C. The SP is MUCH COLDER.
Fun Fact: This information was NOT KNOWN in 1958.
Fun Fact #2: By 1998 we had mapped this curve BUT we still did not know how it would respond to increasing global temperatures.
Consider how little we knew as late as 1998.
Latitudinal temperature gradients and climate change
JOURNAL OF GEOPHYSICAL RESEARCH, VOL. 103, NO. D6, PAGES 5943-5971, MARCH 27, 1998
The first sentence of this paper asks.
“How variable is the latitudinal temperature gradient with climate change?”
Then goes on to tell us that;
“This question is second in importance only to the question of overall climate sensitivity. Our current inability to answer it affects everything from understanding past climate variations, and paleoclimate proxies, to projections of regional effects of future greenhouse warming [Rind, 1995].”
THIS WAS IN 1998!
By 1998 we had already increased atmospheric CO2 levels higher than they had been in over 7 million years.

By 1998 we had “irrevocably” altered the ENERGY STATE of the Earth’s Climate System and we still DID NOT KNOW what the consequences of that action were going to be.
Again, from the 1998 paper.
“Future climate projections from different models show substantial differences in the projected latitudinal temperature response from anthropogenic greenhouse perturbations.
For transient climate changes, some coupled atmosphere-ocean models show a reduction in North Atlantic Deep Water production, leading to cooling at high latitudes, at least in the North Atlantic-European sector [e.g., Washington and Meehl, 1989; Manabe and Stouffer, 1994; Russell and Rind, 1997]. Some models also find temperatures cool initially at high southern latitudes with increased CO2 [Manabe et al., 1990; Russell and Rind, 1997].
#These researchers thought it might cause the Polar Zones to get colder, at least in the “short term”.#
Doubled CO2 equilibrium simulations from different atmosphere-mixed layer ocean models show different degrees of high-latitude climate warming amplification; in the GFDL model, the temperature response at high latitudes is 3-4 times that at the equator, while in the GISS model, it is only close to a factor of 2 [Rind, 1987a].
#Now we know, the GISS model was WRONG.#
The regional response in these different models depends on these differences in equator-to-pole gradients, which affects the hydrologic cycle, in general, and storm energetics [Rind, 1987a, 1988].
An obvious goal would be to clarify gradient changes by improving the quality and geographic distribution of paleoclimate observations and the representation of physical processes, particularly convection, sea ice, and ocean circulation, in GCMs for future prediction.
“If we knew what to expect, it might be possible to infer changes in the latitudinal temperature gradient from observations already available.”
In 1998 this was regarded as literally a “life or death” question that needed to be resolved ASAP.
Because, the answer would tell us if we were “safe”. Or, if we had caused a “Global Warming Catastrophe”.
What the Northern Hemisphere Equator-to-Pole-Temperature-Gradient-Curve tells us about how the Climate System works, and why they were concerned about it in 1998.

The way to understand this graph is to visualize the polar temperature as “floating” on the leftover HEAT ENERGY from the Equator.

The “heat loss constant” in this case is -0.62C per degree of latitude.
Meaning, that for every degree North you go away from the Equator, subtract 0.62C of HEAT from the amount you started with. Remember, there are only 90 degrees of latitude between the Equator and each of the Poles.
The North Pole seems cold to us. But 38% of the HEAT ENERGY that starts at the Equator winds up there, and STAYS.
What we didn't know in 1998, was how the Climate System would respond to the additional HEAT ENERGY we were forcing into it.
There were three main theories.
The North Pole would just ‘eat’ the extra HEAT ENERGY.
The temperature at the North Pole would go up, “slightly”.
The temperature at the North Pole would go up, “A LOT”.
What was starting to scare Climate Scientists in 1998, was that they had believed the answer would be #1 or #2. But new fossil evidence, indicated it was #3.

Under theories #1 and #2, atmospheric CO2 levels would have had to have been around 20,000ppm for temperatures in the Arctic to get that warm.
Even in 1998 there was NO EVIDENCE to support that idea. Instead, evidence was accumulating that indicated atmospheric CO2 levels had NEVER gone above 2,000ppm in over 500 million years.

Which meant that the “Climate Sensitivity” to CO2 had to be MUCH higher than they thought. Or, that temperatures in the Polar Zones, particularly in the Arctic, could increase “much more” and “much faster” than projected in the models.
In the 1998 paper, Rind is clearly aware of this problem and its implications. However, he does not challenge the prevailing paradigm of the “Climate Moderates”. Instead, he articulates the issue and calls for
“improving the quality and geographic distribution of paleoclimate observations and the representation of physical processes, particularly convection, sea ice, and ocean circulation, in GCMs for future prediction”.
THIS WAS DONE. THE RESULTS ARE IN.
Some Thoughts on Global Climate Change: The Transition for Icehouse to Hothouse Conditions
From book: Earth History: The Evolution of the Earth System (2016)

Rind’s “worst case” fears of 1998, turned out to be our “Climate Reality”.
In 1998, David Rind of NASA/GISS understood the implications of the fossil evidence. Alligators had lived in an “ice free” High Arctic 53 million years ago and palm trees had grown in Northern Alaska. The fossil evidence was clear, and it cast serious doubts about the existing “Climate Science Paradigm” of the Climate Science Moderates.
Because there was NO WAY that was possible using their models.
The world wasn't different enough 53 million years ago to make that kind of warming possible.
So, either our understanding of the paleoclimate history had to be incomplete. Or, our understanding of the Climate System had to be deeply flawed.
Here are Rind’s thoughts from 1998 after using the best Climate Models of the time to simulate a variety of paleoclimate conditions.
“What do these (climate model) results imply about potential impacts of future climate change?
Again, one would have to overlay the climate change itself on any latitudinal temperature gradient change, recognizing that some of the latitudinal gradient effects may be overwhelmed.
The doubled CO2 simulation reported here showed little gradient change on the annual average at most latitudes (Figure 13).
Were the temperature gradient to be reduced, experiment 4 is the most likely analog, with results as in Figure 5 (drying in the tropics and lower middle latitudes, moistening in the subtropics and higher latitudes)".
Rind then asks,
“Can we use the results from the paleoclimate analysis to suggest what is likely with increasing CO2?”
“The precise relevance of past to future climates has been extensively discussed [e.g., Webb and Wigley, 1985; Mitchell, 1990; Crowley, 1990; Rind, 1993]; difficulties include the rapid nature of the projected future climate change, the different current climate background (land ice, continental configuration, ocean circulation), and questions concerning appropriate paleoclimate forcing.
Given these ambiguities, any conclusion as to the effects of increased CO2 on the future latitudinal temperature gradient based on paleoclimates must be highly speculative.
It appears obvious that the extratropical temperature gradient was decreased in the warmer climates and increased during the Last Glacial Maximum, but at least some of this was amplified by the land ice changes. A more modified version of this effect is likely in the future.
We estimate that the early and mid-Mesozoic maintained something like the current temperature gradient from 0 to 30 degrees of latitude. While the Last Glacial Maximum had a small gradient over these same latitudes.
These conclusions imply that if CO2 was the major forcing factor, significant tropical as well as polar sensitivity to the future greenhouse forcing may be expected.
The aridity in the Mesozoic looks more like ocean heat transport effects (Figure 13, bottom), although for the ice ages, the simulations of Manabe and Broccoli [1985] and Webb et al. [1997] suggest CO2 change was dominant, even with magnified land ice. A reduction in poleward heat transport, as would arise from the NADW decreases seen in some coupled models, or lack of change of high-latitude sea ice in the southern hemisphere would exacerbate the situation.
The recent changes in the latitudinal temperature gradient also do not suggest a strong decrease is imminent.
If it does not occur, it will reduce the likelihood that there will be midlatitude drying, a possibility raised by results such as the doubled CO2 simulations of Manabe and Wetheraid [1987], with a GCM that produced a strong reduction in the latitudinal temperature gradient. Droughts at lower latitudes might then be a bigger problem [Rind et al., 1990].
So, what's he saying?
Rind was a member of the “Moderate Faction” in Climate Science. They held that the Climate System was resistant to change, had self regulating feedbacks, and would warm slowly over centuries or millennia.
He’s saying that at CO2 levels of 560ppm his team’s Climate Model found that.
The doubled CO2 simulation reported here showed little gradient change on the annual average at most latitudes (Figure 13).

In “Alarmist” models which increased the forcing power of CO2, “significant tropical as well as polar sensitivity to the future greenhouse forcing may be expected.”
Which, while Rind was honest enough to admit, he clearly doesn't expect to be true. He was calling for additional paleoclimate research because this question needed to be answered. But, he is clearly expecting the research to vindicate his ideas and provide a “paradigm compatible” explanation for the fossil evidence.
Here's what the paleoclimate research indicates about how the Climate System really works.

In this graphic there are seven different “climate states” shown for a variety of different periods of the Earth. The Tropics-to-Pole Temperature Gradient is shown for each of these climate states, in both of two hemispheres.
The way to use the graph, is to pick the state each of the poles is currently in and average the results to get the Global Mean Temperature of the planet. We are currently in a 5/7 configuration, so the GMT should be around 15C (59F). Which, of course, is the current GMT.
Now, what happens if we dump enough CO2 into the atmosphere to raise the GMT by +4C?
At the North Pole temperatures go up about +20C. Shrinking the difference between the Equator and the NP from 45C to just 25C. Meaning that if is 77F at the Equator we would expect it to be about 32F at the North Pole.
This is what the “near term” future of the Arctic looks like. It’s a LOT hotter than the rest of the planet.
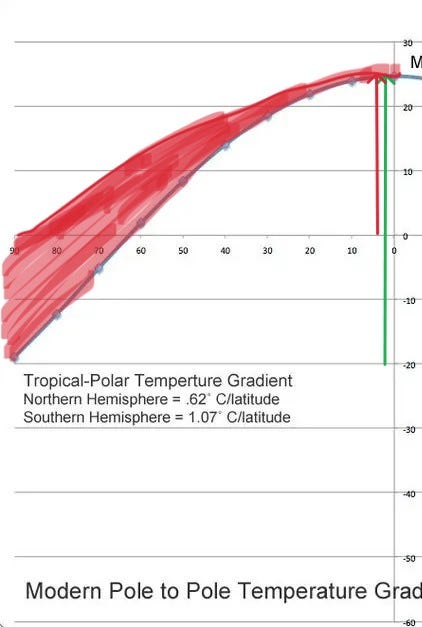
What the paleoclimate data indicates, is that an “avalanche of heat” is in the process of raising the High Arctic temperature by about +20C.
If that seems “far fetched” to you, remember the High Arctic has ALREADY warmed about +4C ON AVERAGE. Parts of it have warmed +7C.
Around 2015 the RATE of Warming jumped up again. It went from about +0.18C per decade to about +0.36C per decade. AT THE EQUATOR.
In the High Arctic that's going to mean temperature increases of +1.5C per decade on average. With Siberia warming at about +2.5C PER DECADE.
At that rate, the High Arctic and the rest of the world will reach a +4C equilibrium, around 2125. Or, in roughly 100 years.

This isn't the “far future” anymore. This is where we are probably headed in about 100 years. Possibly less.
Because, the WARMING of the High Arctic is going to have SEVERE consequences for the entire planet.
It’s probably going to melt the Northern Permafrost.
The cascade of “tipping points” this triggers, will probably warm the Earth an additional +3/+4C when Climate/Thermal Equilibrium is reached.
According to the Alaska Department of Fish and Game “about 85% of Alaska's land area is underlain by permafrost”. Eighty five percent, almost the ENTIRE state sits on permafrost.
How about Russia, how much of Russia do you think is underlain by permafrost?
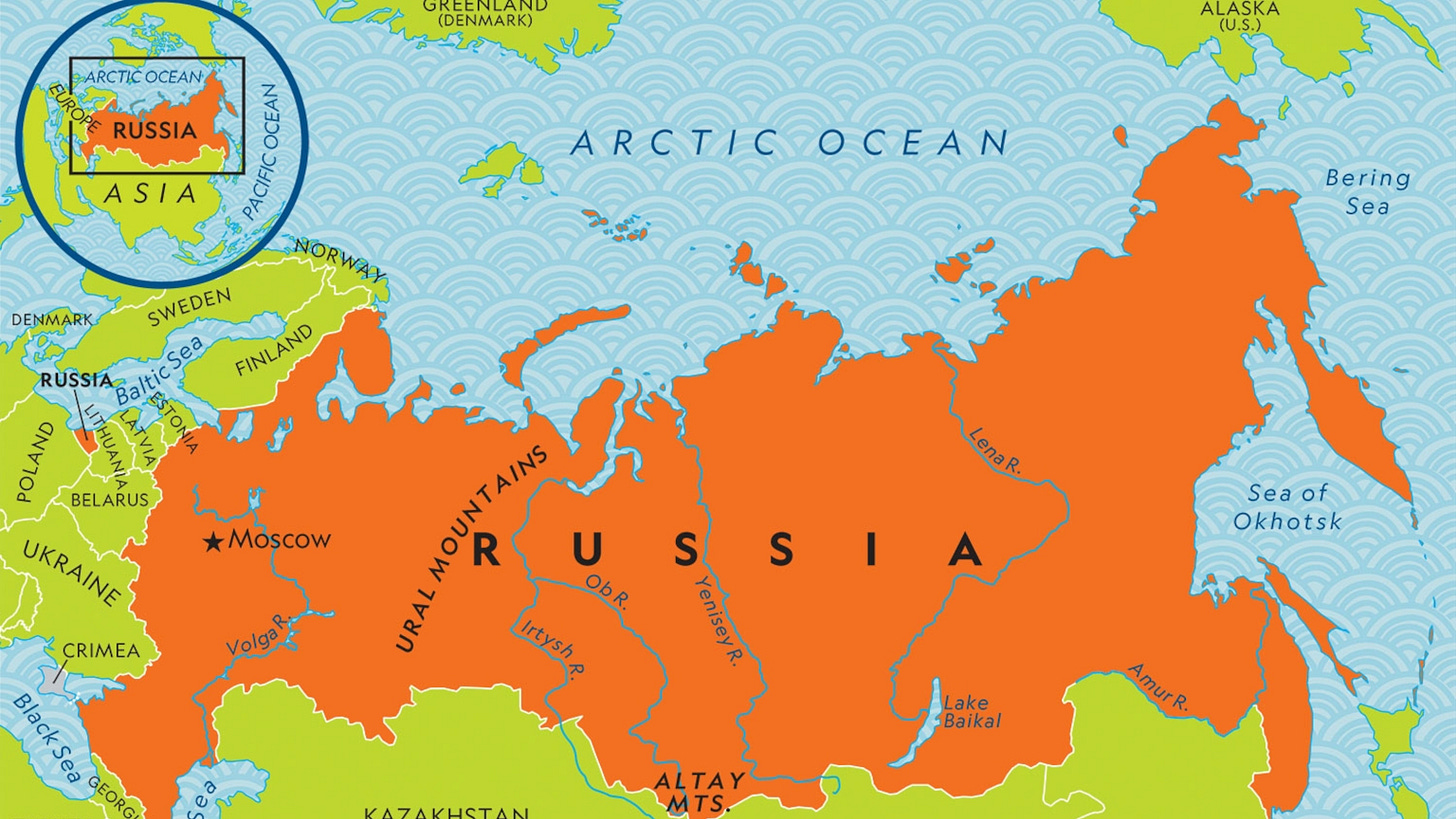
Sixty-five percent, roughly two-thirds of Russia.
In Canada, it’s about 50%.

If you don't know how much permafrost there is in the world, it's understandable.
Globally, very few people live in areas where permafrost exists. Those areas are in the High-Latitudes, far to the North. The Climate is cold and extreme. The Winters long and dark. Most of us have spent our entire lives without visiting a “permafrost zone”.
So our general ignorance about permafrost is understandable. Most of us don't think about things that don't influence us directly.
The “Permafrost Melt” that's happening, it's about to affect your life. Because Permafrost covers 24 percent of the land area in the northern hemisphere and accounts for nearly half of all organic carbon stored within the planet’s soil.
The AVALANCHE of HEAT that we are calling “Arctic Amplification” is about to melt ALL of it. This is a catastrophically bad consequence of our misunderstanding of the Climate System.
In 2020 the Arctic Institute warned that a 3 degree Celsius increase in global temperatures could melt 30 to 85 percent of the top permafrost layers that exist across the Arctic region.
The Arctic has ALREADY WARMED +4C on AVERAGE. Parts of it have warmed +7C.
The Arctic has warmed nearly four times faster than the globe since 1979
Communications Earth & Environment volume 3, Article number: 168 (Aug 2022)

What graphic “c” is showing, is the AMPLIFICATION of warming that results from this accumulating HEAT ENERGY. Areas of the Arctic Polar Zone have warmed as much as +7C since 1979. Most of it has warmed +3C to +4C.
At this point, there is NO WAY to stop this avalanche. We have already warmed the Arctic enough to melt at least 60% of the permafrost.
The paleoclimate datasets indicate it's going to get a LOT hotter.
Very rapidly.
In 100 years ALL of the permafrost is going to melt.
The CONSEQUENCES are going to be SEVERE.
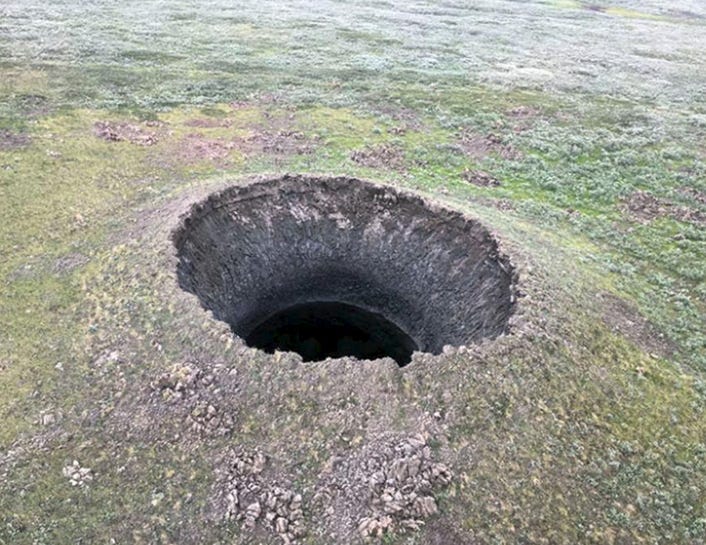
This “slumping” isn't trivial.
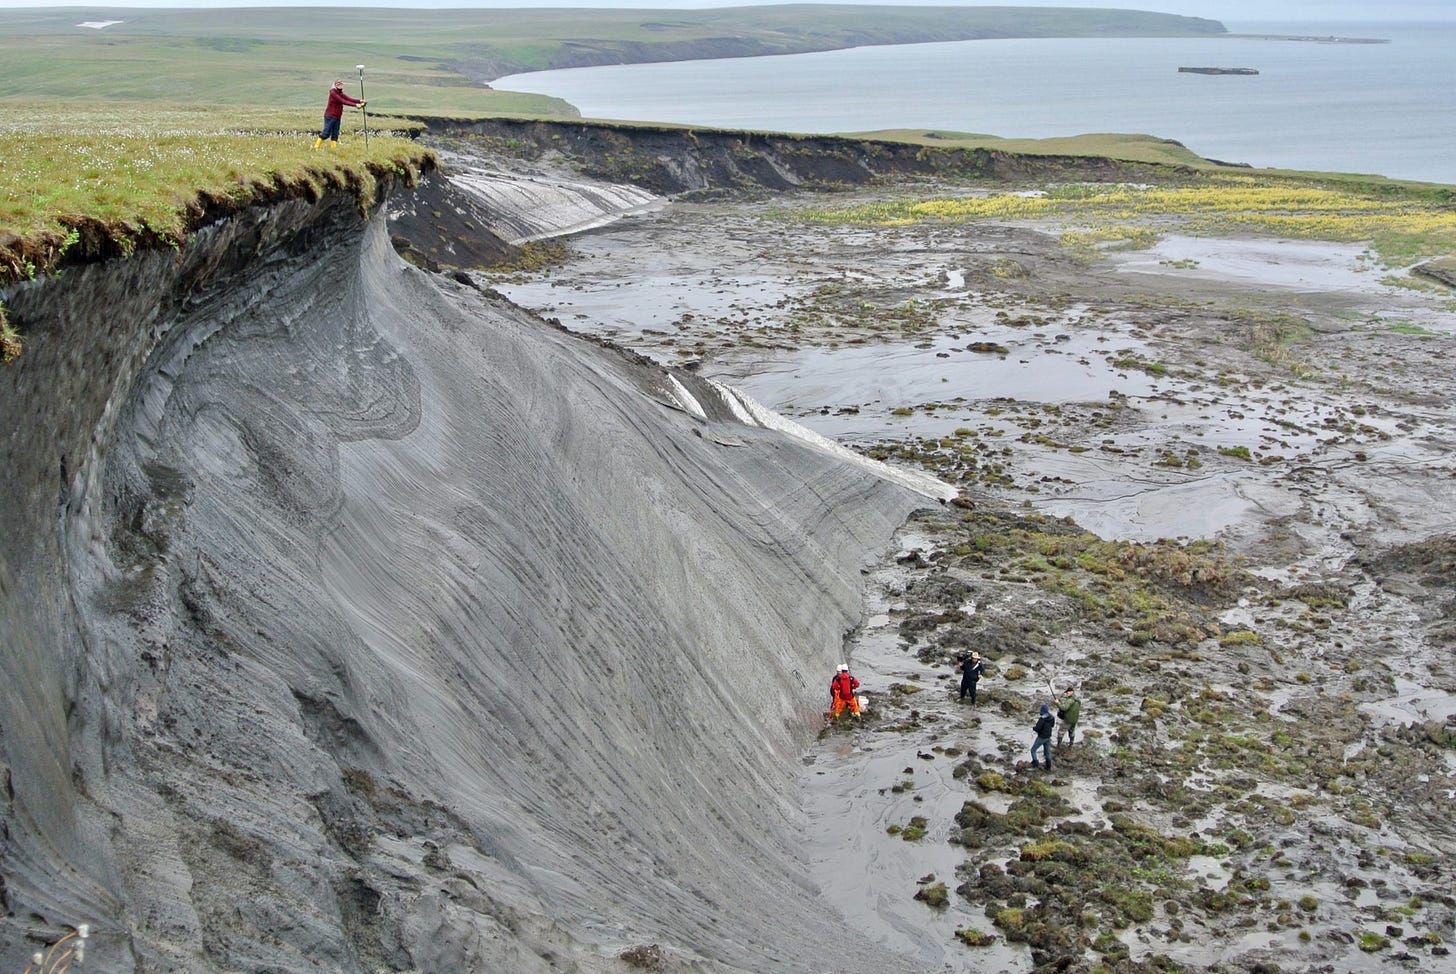
This happens when the frozen soil in the permafrost is mostly sand. The permafrost also contains areas with high concentrations of organic carbon.

There is a LOT of Carbon currently locked up in the permafrost.
As permafrost thaws, microbial communities frozen in the soil “wake up” and, like yeast, begin to metabolize the carbon that’s stored in the soil.
These microbes breathe in oxygen and breathe out carbon dioxide. Just like people do.
Specialized microbes called methanogens, generate methane, a greenhouse gas more powerful than carbon dioxide, as a by-product of their metabolism.
The rich organic and waterlogged soils left behind as permafrost thaws in certain areas “are the perfect conditions for methanogens,”
Permafrost thaw contributes to a positive feedback loop that further accelerates the warming of Earth, by releasing methane or CH4. CH4 is a MUCH more powerful greenhouse gas than carbon.
Though its lifespan in the atmosphere is much shorter than carbon dioxide, methane’s impact on climate change has been found to be 25 times greater over a 100-year period.
In Siberia, methane can “blast” out of the ground.
“The estimated amounts of natural gas in the subsurface of North Siberia are huge. When parts of this will be added to the atmosphere upon thawing of the permafrost, this could have dramatic impacts on the already overheated global climate.’
August 2, 2021 - 118 (32) e2107632118 https://doi.org/10.1073/pnas.2107632118
While the methane released from the permafrost will be intense, the CO2 released will change the Climate for thousands of years.
Terrifying Study Finds Melting Permafrost Could Unleash Way More Carbon Than We Thought. (2021)
While the Arctic was previously considered a carbon sink, new research shows that the region is emitting more carbon than it is absorbing, largely due to permafrost thaw. It is estimated that the world’s permafrost contains up to 1,700 billion tonnes of carbon, which is almost double the amount of carbon in the Earth’s atmosphere, and four times more than what has already been emitted by humans as since the Industrial Revolution.
If all permafrost were degraded to the point of decomposing, the disastrous effects would be felt all over the world.
Iron mineral dissolution releases iron and associated organic carbon during permafrost thaw
Nature Communications volume 11, Article number: 6329 (2020)
There may be greater CO2 emissions associated with thawing Arctic permafrost than ever imagined. An international team of researchers, including one from the University of Copenhagen, has discovered that soil bacteria release CO2 previously thought to be trapped by iron. The finding presents a large new carbon footprint that is unaccounted for in current climate models.
Arctic permafrost releases more CO2 than once believed (2021)
Iron doesn't bind organic carbon after all.
Researchers have long been aware that microorganisms play a key role in the release of CO2 as permafrost melts. Microorganisms activated as the permafrost thaws convert dead plants and other organic material into greenhouse gases like methane, nitrous oxide and carbon dioxide.
It was believed that the mineral iron would bind carbon even as permafrost thawed. The new field study demonstrates that bacteria incapacitate iron's carbon trapping ability, resulting in the release of vast amounts of CO2. This is an entirely new discovery.
"What we see is that bacteria simply use iron minerals as a food source. As they feed, the bonds which had trapped carbon are destroyed and it is released into the atmosphere as greenhouse gas," explains Associate Professor Carsten W. Müller of the University of Copenhagen's Department of Geosciences and Natural Resource Management. He elaborates:
"Frozen soil has a high oxygen content, which keeps iron minerals stable and allows carbon to bind to them. But as soon as the ice melts and turns to water, oxygen levels drop and the iron becomes unstable. At the same time, the melted ice permits access to bacteria. As a whole, this is what releases stored carbon as CO2.”
The amount of stored carbon that is bound to iron and will get converted to CO2 when released, is estimated to be somewhere between two and five times the amount of carbon released annually through anthropogenic fossil fuel emissions.
If just 50% of the carbon frozen in the permafrost becomes CO2, that will add about 280ppm to the atmospheric CO2 level. If we put ZERO CO2 into the atmosphere from this point forward, atmospheric CO2 levels could still climb to +700ppm.
That’s not counting the +200ppm that the burning of the Boreal Forests could also add to the total.
The World’s Forests are Burning, Ecosystem Turnover is the Cause. Let’s All be Really Clear on What that Means.
The CONSEQUENCES of Permafrost Melt are going to be SEVERE.
It’s going to happen a lot faster than they thought in 1998.
This is my analysis.
This is what I see.
This is my “Crisis Report”.
— rc
Scheduled for release 07/01/23 while I am on vacation and AfK.


