


The Crisis Report - 105
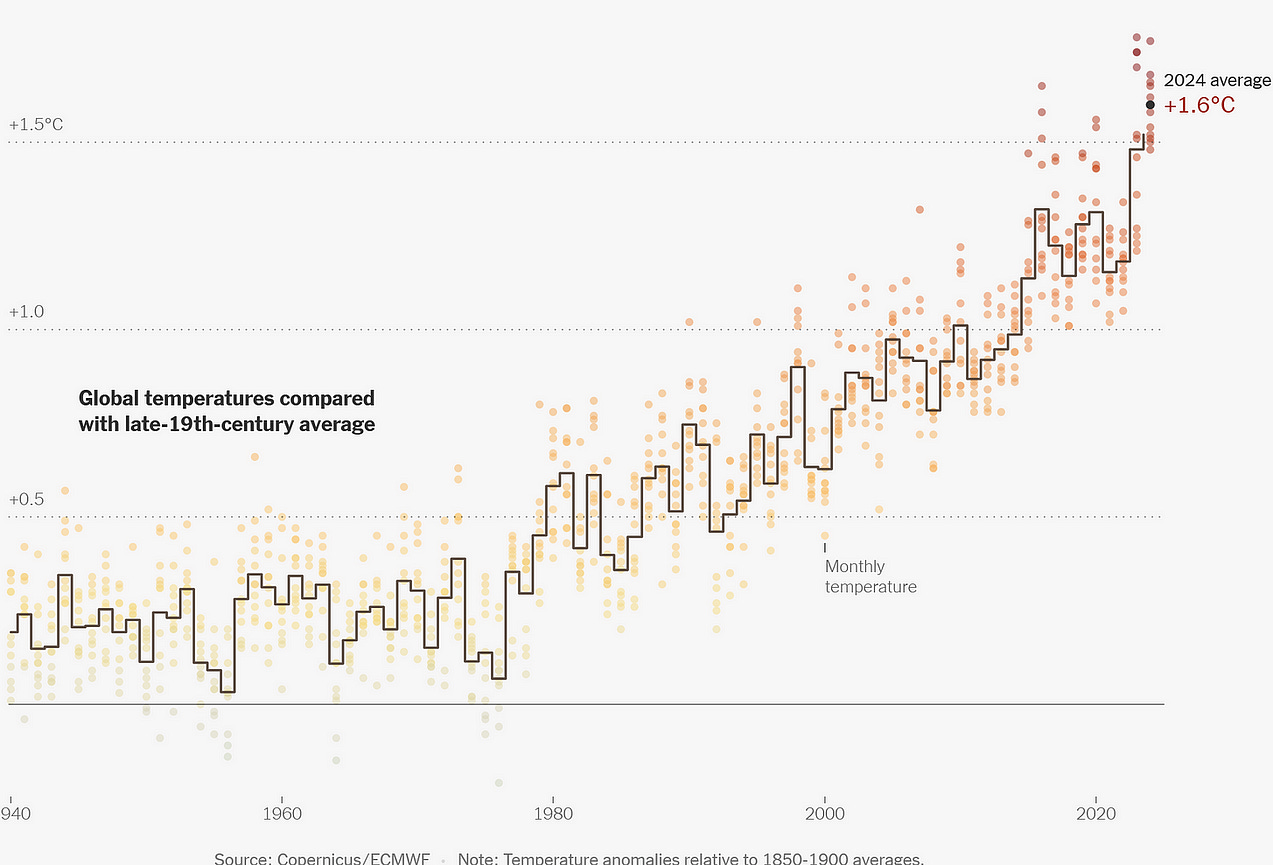
2024 marks the first time since record keeping began that all of the 10 hottest years have fallen within the most recent decade.


“That’s never happened before,” said Chris Hewitt, the director of the W.M.O.’s climate services division.
2024 was +1.55°C relative to a “pre-industrial” (1850–1900) baseline according to the World Meteorology Organization (WMO).
The Europeans say +1.6°C.

Berkeley Earth, doing an independent analysis, agrees with the Europeans.

You have to look close to see it in the Berkeley Earth graph but, the two LOWEST numbers for 2024 came from the American climate agencies GISTEMP and NOAA. The English (HadCRUT5) came in a little higher. The Europeans (ECMWF) came in the highest at +1.6°C for the year. Berkeley Earth, which is VERY mainstream, agreed with the Europeans.
Here’s a clearer way of seeing that.

SO, the “official number” for 2024 is +1.55, right?
Not, exactly. It depends on who you want to believe.
The American climate science agencies “disagreed”. They didn’t see +1.5°C of warming over baseline in 2024. NOAA, which is ALWAYS the lowest number for warming, reported 2024 as just +1.45°C over baseline.
The difference between +1.6°C of warming and +1.45°C of warming is 0.15°C. That sounds like a really small number, it’s just over a tenth of a degree.
Between 1975 and 2014 the Rate of Warming averaged about +0.18°C PER DECADE.
As recently as 2014, warming of +0.15°C took about 10 years.
NASA/GISS and NOAA are officially estimating the Rate of Warming as now being about +0.27°C per decade. So +0.15°C is about FIVE YEARS of warming according to American estimates.
That’s what the “tiny difference” between the two interpretations of how warm 2024 was means “in real life”. About 5 years of your life.
If 2024 was +1.6°C over baseline. How can we still be talking about “holding” warming to +1.5°C?. Again, how warm it’s gotten depends on how you look at it. Here’s the IPCC interpretation.
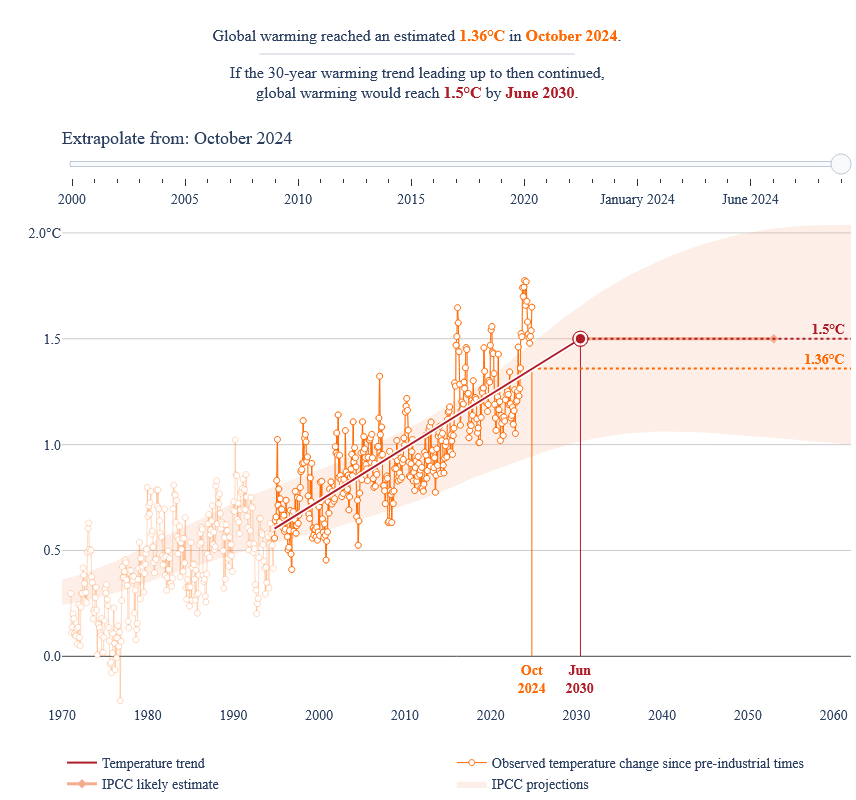
In this case they are using a 30 year running average to determine the temperature for 2024. This btw is the “gold standard” in climate science. It’s designed to filter out the “noise” of year to year swings and give a “true” number for global warming.
That gives a RoW (Rate of Warming) of, no surprise, +0.028°C per year. Or, +0.28°C per decade. In case you were wondering how they came up with that +0.27°C per decade estimate for the current RoW.
Looking at it that way is what allows the IPCC and UN to say things like this.
Reaching 1.5°C of global warming above pre-industrial levels — a limit agreed under the Paris agreement — may feel like a very distant reality, but it might be closer than you think. Experts suggest it is likely to happen between the late 2020s and the early 2050s.
Even though energy usage related carbon emissions reached a record in 2024. Even in the face of that reality, the I.E.A. estimated last fall that global carbon-dioxide emissions will peak in the next few years, then fall 3% annually by 2030 under current national policy commitments.”
Global emissions would need to fall an annual 43% by 2030 in order to keep global warming below the 1.5-degree Celsius threshold established in the 2015 Paris Agreement, according to the U.N.
Does it seem LIKELY to you that “global emissions” are going to fall by half over the next 5 years?
Particularly when the NYT article this was mentioned in, was about how emissions increased in 2024 due to a MASSIVE surge in air conditioning usage. Because it was so CRAZY HOT in 2024.
Climate: A vicious energy cycle
A resident of Brooklyn with an air-conditioner in July. Graham Dickie/The New York Times That's because hotter weather…messaging-custom-newsletters.nytimes.com
Still, according to the IPCC and Mainstream Climate Science, saying that we have “breached” the +1.5°C goal of the Paris Accord is “premature”. Who knows, the current warming might just be “natural variation”. Maybe the next five years the planet cools down a few tenths of a degree and falls below 2024’s +1.55°C (WMO).
Maybe there’s a global depression, like in the 30’s, and CO2 emissions drop by 40% because half the world is out of work. That’s one way of reducing emissions.
It’s a DRASTIC solution to be sure and one that comes with CONSEQUENCES for the Climate System.

Although, it seems certain that if we did cut CO2 emissions and SOx aerosol emissions 50% because of a global depression, temperatures would climb above +1.5°C. BUT, CO2 emissions would fall enough to theoretically reduce the RoW to zero and keep warming BELOW +1.5°C over baseline.
THEORETICALLY.
In reality, probably not but, it lets the IPCC act like +1.5°C still means something for another 5 years.
However, let's get back to today’s news.
2024 marks the first time since record keeping began that all of the 10 hottest years have fallen within the most recent decade.

What the Hell happened in 2014 to trigger this?
Two things actually.
China banned the burning of “high sulfur” coal in order to reduce air pollution and the planetary ALBEDO level dropped significantly. The two things are probably interrelated.
FYI- In February and March 2014, Russia invaded the Crimean Peninsula, part of Ukraine, and then annexed it. An interesting coincidence, that.

See the graph above. That's what was going on with the Earth’s albedo between 1999 and 2019. This graph should be right up there with the famous “hockey stick” graph. It’s that important.
I wrote about this in February 2022 in this article.
Climate Report Part Three continued…..smokingtyger.medium.com
And again in April that same year.
I’m actually being “conservative” when I tell you that things are bad…smokingtyger.medium.com
I republished those articles here on Substack as this series in December of 2022.
006 - Heat doesn't "just happen". Where it’s coming from, and why that matters to all of us. Part One.
007 – Heat doesn't "just happen". Where it’s coming from, and why that matters to all of us. Part Two. The Earth's Albedo has dimmed since the 90's. In the clinical language of science, this is an "unexpected feedback".
008 – Heat doesn't "just happen". Where it’s coming from, and why that matters to all of us. Part Three. Additional notes on Albedo Diminishment. I’m actually being “conservative” when I tell you that things are bad.
009 - Heat doesn't "just happen". Where it’s coming from, and why that matters to all of us. Part Four. We know from the Earthshine Project, and the NASA CERES observations, that the Earth's Albedo has dimmed. The question is, "why"?

Because.
What this graph shows is a “dimming” of the earth’s albedo over a 20 year period. With a significant acceleration of this dimming starting in 2014.
The NASA CERES data show a decline of 1.8W/m2 in the planetary albedo level from 2000 to 2019.
This decline doubled the ENERGY in the Climate System. It has persisted right up to the present.

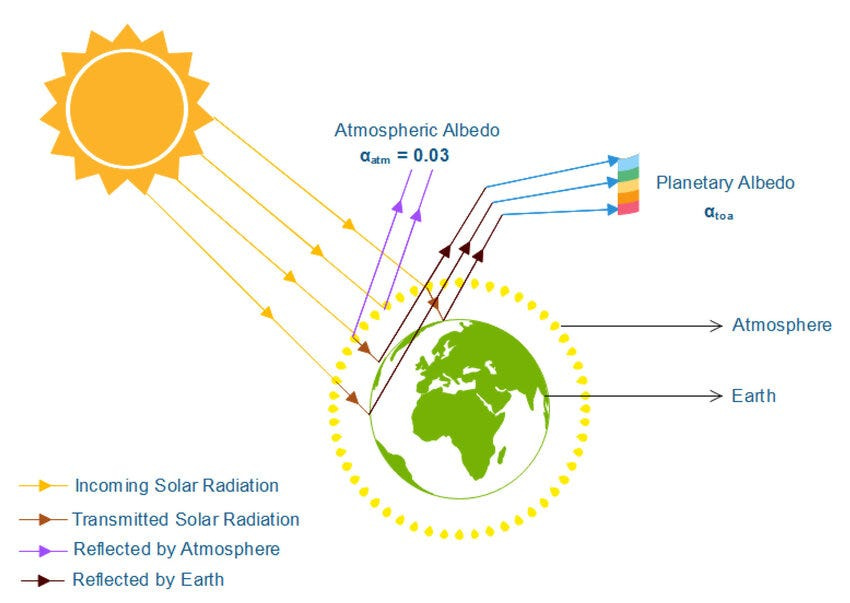
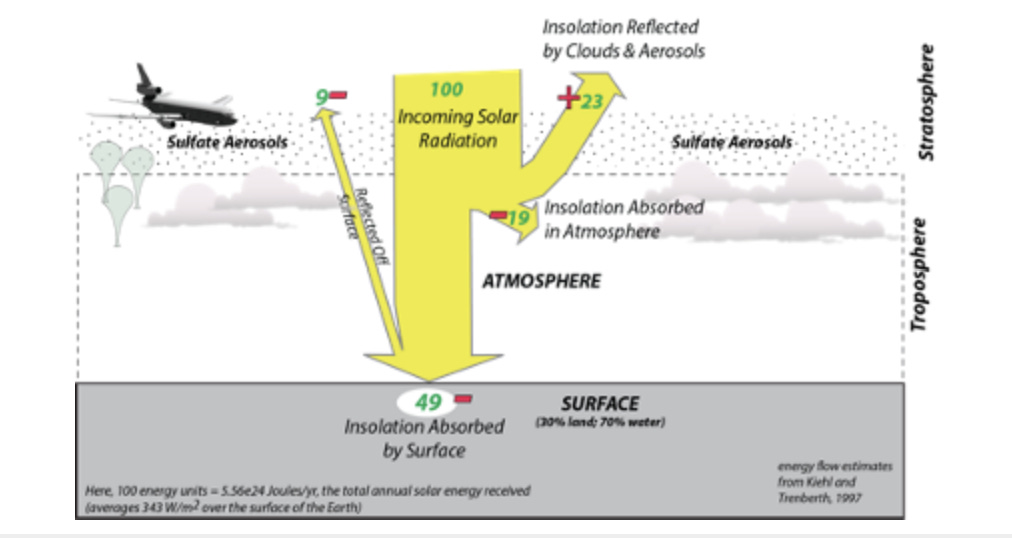
Now, if you aren’t an astronomy or climate science nerd, you might be unclear on exactly what the Earth's Albedo is and how it works. It’s about “reflectivity”.
“Reflectivity” is about what you would expect. It’s a measure of how much energy a surface absorbs and how much it “reflects “away. We intuitively understand this phenomenon.
“Dark objects left out in the sun get warm. Lighter-colored objects, not so much. On a planetary scale, this simple, familiar phenomenon — associated with a characteristic called albedo — drives weather and climate.”
The degree of reflectivity of a material in astronomical terms is its “albedo”.
Core Concept: Albedo is a simple concept that plays complicated roles in climate and astronomy
Here's how that works with clouds.
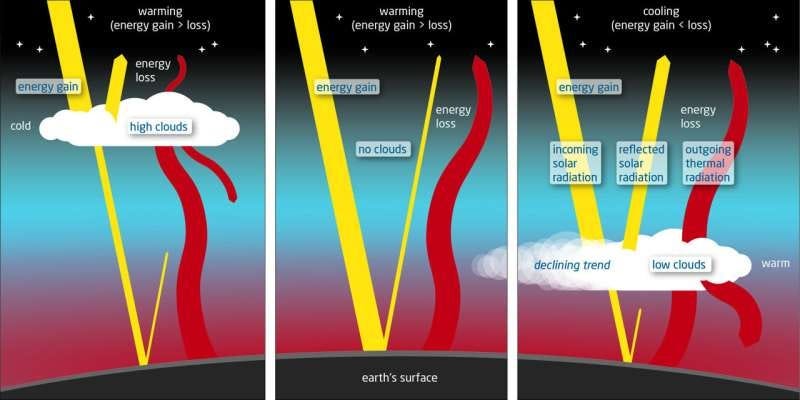
Here’s an example of how it works at the surface.

The climate is VERY sensitive to a reduced ALBEDO.
Scientists at NASA\GISS calculate that a reduction in albedo of just -1% produces a warming effect equal to a doubling of CO2 in the atmosphere.
From: Changes in Earth’s Albedo Measured by Satellite, Wielicki and 5 co-authors, Science 2005, https://doi.org/10.1126/science.1106484
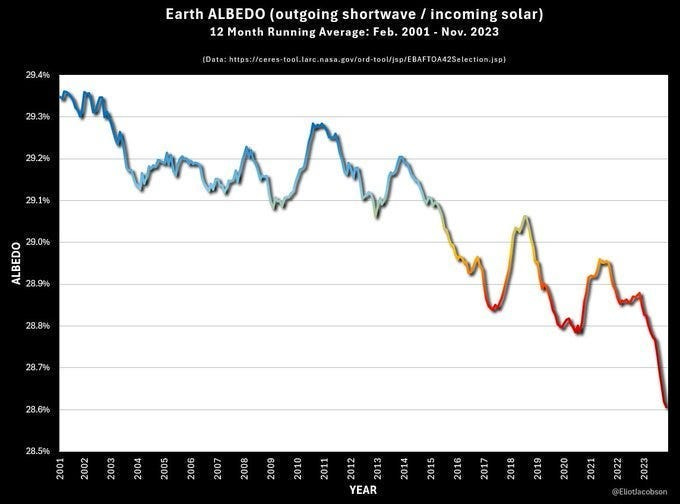
If you understand about the dimming of the albedo. The fact that the last 10 years have been the warmest on record really makes a LOT of sense. The albedo has been “dimming” for at least 20 years as the earth was warming up. Then in 2014 that dimming accelerated and planetary warming surged upwards.
Here’s a really important thing to understand clearly.
This warming has nothing to do with CO2 warming. This warming is “IN ADDITION” to the warming caused by increases in atmospheric CO2.
CO2 “traps” outgoing longwave radiation that the land/oceans release as heat. It has little effect on the short wave solar radiation that’s reflected from the atmosphere and surface.
SO, what caused the albedo dimming and why did it accelerate in 2014?
Is this about sulfate aerosols, is this about clouds, or is it a combination of both.
Sulfate Aerosols
We have NEVER measured this effect directly. So, there is a LOT of argument about it. This is a KEY Point to understand about the faction fight going on in Climate Science.
Both the Moderates and the Alarmists agree that SOx aerosols cool the earth by increasing the albedo and reflecting sunlight away. They DISAGREE by a factor of 10X on the strength of this effect.
This is a very “significant” difference of opinion.
This is a HUGE unresolved question in Climate Science and one the Moderates do not want to yield on. To understand why, you have to go back to 1979 and the Woods Hole Climate Summit.
In 1979 NO ONE knew much about SOx aerosols ability to increase the albedo and cool the planet. The Moderate estimates of climate sensitivity are based on the “observed warming” between 1850 and 1979.
In this paper “Climate effects of aerosols reduce economic inequality” published in 2020, the lead author states:
“Estimates indicate that aerosol pollution emitted by humans is offsetting about 0.7 degrees Celsius, or about 1.3 degrees Fahrenheit, of the warming due to greenhouse gas emissions. This translates to a 40-year delay in the effects of climate change. Without cooling caused by aerosol emissions, we would have achieved 2010-level global mean temperatures in 1970.”
If the Moderate value for climate sensitivity is based on what they could see AND they didn’t know that SOx was “hiding” about 0.7°C of warming from them. They would get a value for 2XCO2 that was about 40–50% too low.
In 1979 the Moderates and the Fossil Fuel Industry scientists at the Woods Hole Climate Conference agreed that “based on what they observed” doubling the amount of CO2 in the atmosphere (2XCO2) from 280ppm to 560ppm should cause +1.8°C up to +3°C of warming.
The Alarmists (including James Hansen) argued that “based on the physics” warming from 2XCO2 would cause +4.5°C up to +6°C of warming.
One of those values meant that it was “safe-ish” to build America’s energy policy around fossil fuels and keep burning them for a century. The other value meant that we had to stop using fossil fuels ASAP, replace all of our fossil fuel power plants with nuclear, and completely electrify EVERYTHING as soon as humanly possible. While convincing everyone else in the world to do the same and committing to help the Third World do the same.
Does that give you some idea about WHY America chose “option one” during the 80's?
Particularly since the Alarmists could not explain why the observable warming was so much less than what the straight physics indicated it should be. Throughout the 80’s the Alarmists could not explain “where’s the HEAT?” and that allowed the Moderate paradigm to become “mainstream” science.
Then in 1991 Mt. Pinatubo erupted in the Philippines.
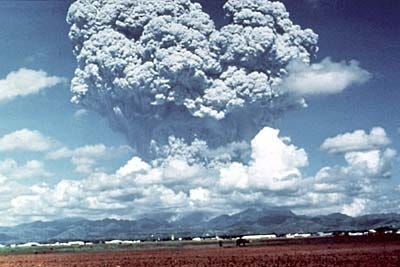
This particular eruption put MASSIVE amounts of sulfate aerosols into the atmosphere and the temperature of the earth dropped dramatically.
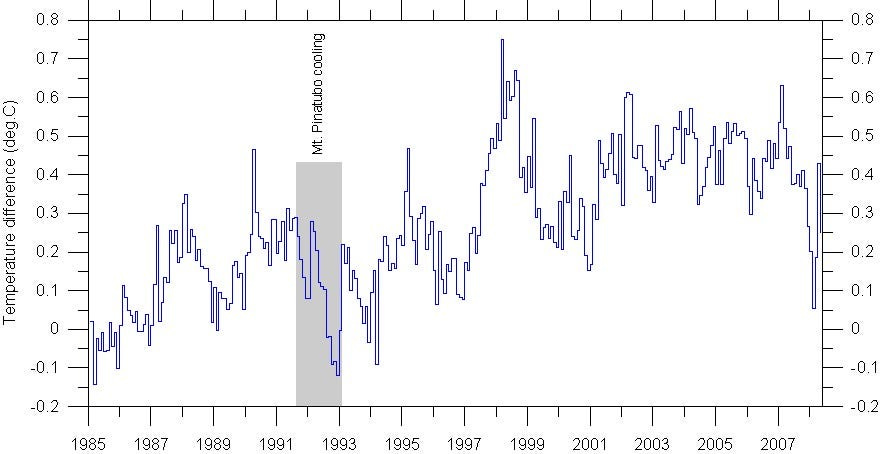
The strength of this effect was a surprise to Climate Science since it was much stronger than anything seen up to then. Hansen wrote this paper in 1992 in response to the eruption.
Hansen, J., A. Lacis, R. Ruedy, and M. Sato, 1992: Potential climate impact of Mount Pinatubo eruption. Geophys. Res. Lett., 19, 215–218, doi:10.1029/91GL02788.
Stating:
We use the GISS global-climate model to make a preliminary estimate of Mount Pinatubo’s climate impact. Assuming the aerosol optical depth is nearly twice as great as for the 1982 El Chichon eruption, the model forecasts a dramatic but temporary break in recent global warming trends.
The simulations indicate that Pinatubo occurred too late in the year to prevent 1991 from becoming one of the warmest years in instrumental records, but intense aerosol cooling is predicted to begin late in 1991 and to maximize late in 1992. The predicted cooling is sufficiently large that by mid 1992 it should even overwhelm global warming associated with an El Niño that appears to be developing, but the El Nino could shift the time of minimum global temperature into 1993.
The model predicts a return to record warm levels in the later 1990s. We estimate the effect of the predicted global cooling on such practical matters as the severity of the coming Soviet winter and the dates of cherry blossoming next spring, and discuss caveats which must accompany these preliminary simulations.
When you look at what actually happened Hansen “nailed it”. His predictions using the Alarmist climate model were “spot on”. You would think that this would have swayed the Moderate faction to reconsider their position. It did not.
The PROBLEM for the Moderate faction was that Hansen’s model used a value for SOx cooling that was so large it required the use of the Alarmists value for 2XCO2 to balance the Climate System. Using Hansen’s value would have required the Moderates to admit that their value for 2XCO2 was WRONG.
SO, Mainstream Climate Science politely told Hansen to “go fuck himself”. Then they decided that the “official value” for the SOx cooling effect was about 1/10th of what Hansen was using. Because, that’s the highest value it could have without breaking their models.
30 years later in 2021 that “disagreement” still stood.
Now, we put SOx aerosols into the atmosphere in two main ways.
On LAND.
And, at SEA.

This pollution is NOT good for people, even if it does cool the planet.

On land it causes “Acid Rain” and potentially deadly “smog”. That’s why the American EPA banned the use of “dirty coal” in the 70’s and the Chinese banned it in 2014. In both cases, after the bans went into effect global temperatures climbed in response.
Between 1900 and 1970 the average Rate of Warming was about +0.08°C per decade. After the US banned high sulfur coal in the 70’s the Rate of warming JUMPED up to +0.18°C per decade.
Aerosol Sulfates have been the “X” factor in the Climate System since the Industrial Revolution kicked into high gear around 1850. We have been geoengineering the earth’s climate system for almost 200 years without knowing it.
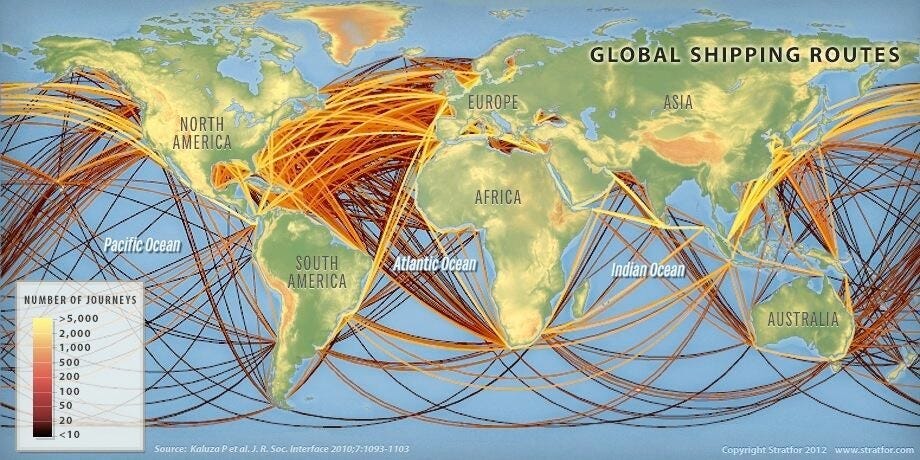
At sea, the shipping industry is among the world’s largest emitters of sulfur behind the energy industry. Before 2020 the sulfur dioxide (SOx) content in heavy fuel oil was up to 3,500 times higher than the latest European diesel standards for vehicles.
“One large vessel in one day can emit more sulfur dioxide than all the new cars that come onto the world’s roads in a year.”
There are a LOT of ships putting SOx into the air all across the planet. This is part of the unseen climate cost of globalization and consumer culture. We move so MUCH “stuff” around the planet that the shipping industry is a form of geoengineering. Unfortunately this pollution causes an estimated 20 million premature deaths each year.
To combat that pollution, the International Maritime Organization’s (IMO) Marine Environment Protection Committee met in London on Oct. 24–28 (2016) and decided to impose a global cap on SOx emissions starting from 2020, which would see sulfur emissions fall from 3.5% of fuel content to 0.5%.
The IMO wanted to be responsible about this change so they did a study to predict the amount of warming this change would cause. This study was done in 2016 by Zeke Hausfather and Robert Rohde of Berkeley Earth. They used the mainstream values for SOx aerosol cooling and estimated that the change in maritime diesel would cause “no more than” +0.06°C of warming.
In the paper “Beyond SOx reductions from shipping: assessing the impact of NOx and carbonaceous-particle controls on human health and climate”, published in 2020 after the change in maritime diesel took effect, the IMO found.
Historically, cargo ships have been powered by low-grade fossil fuels, which emit particles and particle-precursor vapors that impact human health and climate. We used a global chemical-transport model with online aerosol microphysics (GEOS-Chem-TOMAS) to estimate the aerosol health and climate impacts of four emission-control policies: (1) 85% reduction in sulfur oxide (SOx) emissions (Sulf); (2) 85% reduction in SOx and black carbon (BC) emissions (Sulf-BC); (3) 85% reduction in SOx, BC, and organic aerosol (OA) emissions (Sulf-BC-OA); and (4) 85% reduction in SOx, BC, OA, and nitrogen oxide (NOx) emissions (Sulf-BC-OA-NOx).
In contrast to the health benefits, all scenarios lead to a simulated climate warming tendency. The combined aerosol direct radiative effect and cloud-albedo indirect effects (AIE) are +0.027 W/m2 (Sulf) and +0.041 W/m2 (Sulf-BC-OA-NOx). These changes are about 2.1% (Sulf) to 3.2% (Sulf-BC-OA-NOx) of the total anthropogenic aerosol radiative forcing.
Valuation of the impacts suggests that these emissions reductions could produce much larger marginal health benefits ($129–$374 billion annually) than the marginal climate costs ($12–$17 billion annually).
Hansen, in 2021, predicted warming of +0.5°C to +0.6°C of warming from the change. He predicted, that as the existing SOx aerosols washed out of the atmosphere temperatures over the next 3 to 4 years would rapidly increase until all of the warming “masked” by the SOx aerosols had taken place.
Hansen called what was about to happen the “Great Experiment”. Because it would FINALLY reveal whose value for the cooling effect of sulfate aerosols was correct. His or the Moderates.
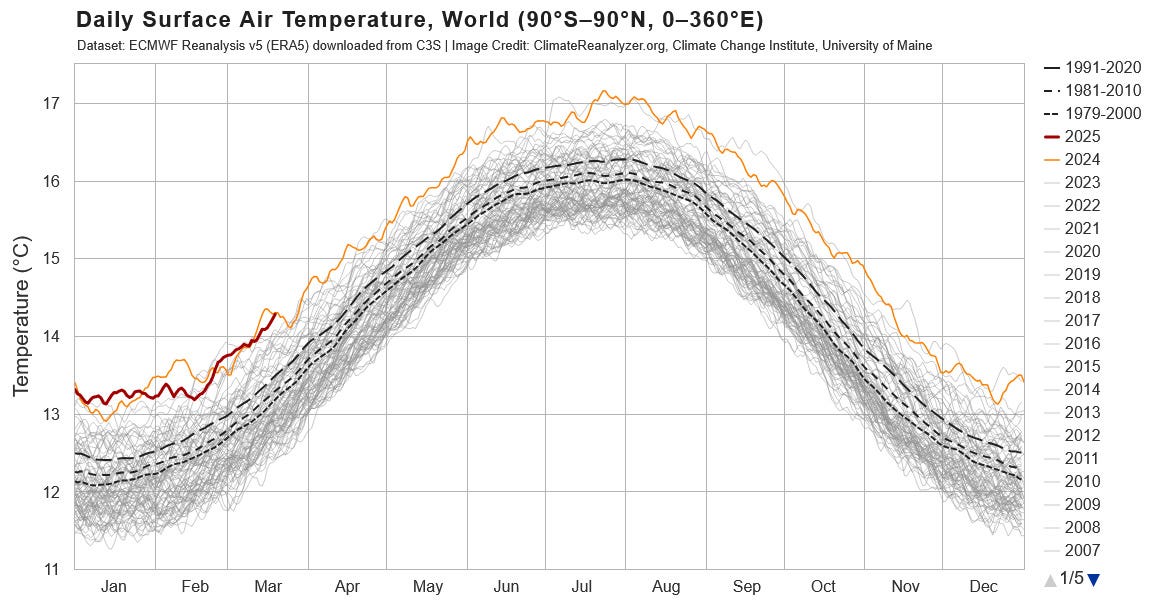
That’s what Hansen thinks and in his most recent post “The Acid Test: Global Temperature in 2025”, he states it clearly.
“2025 might even set a new record despite the present weak La Nina. There are two independent reasons.”
“First, the “new” climate forcing due to reduction of sulfate aerosols over the ocean remains in place, and, second, high climate sensitivity (~4.5°C for doubled CO2) implies that the warming from recently added forcings is still growing significantly.”
“(Secondly) if climate sensitivity is 3°C or less, the rapid, early, response to the ship aerosol forcing introduced in 2020 is complete in 2025, but if climate sensitivity is high, there is still substantial “juice” in the aerosol forcing change, which can thus offset tropical cooling.”
“An acid test for these acidic aerosols will be provided by the 2025 global temperature. January 2025 is the warmest January in the record (Fig. 6) despite the current weak La Nina (which may fade into an ENSO-neutral state in the next few months), but February so far is much cooler than in 2024.”
“We expect the ship aerosol forcing and high climate sensitivity to provide sufficient push to largely offset the effect of the La Nina cycle. Indeed, we expect 2025 to be in competition with 2024 for the warmest year, and we would not be surprised if 2025 is a new record high.”


Mainstream Climate Science has “sorta” started admitting that Hansen might be right.
Why Were 2023 and 2024 So Hot?
Each of the last six decades was hotter than the last, and we're on track for another record year…..blog.ucs.org
“This is why 2023 and 2024 are so alarming: El Niño was only moderately strong (contributing a small amount of warming) in 2023 and was in a neutral state for most of 2024 (contributing almost no warming), so we cannot attribute the record-breaking warmth of 2023 and 2024 to El Niño like we did in 2016, and we definitely should not be shattering heat records under a neutral state El Niño. In other words, 2023 and 2024 have been much hotter than scientists’ predictions.”
“What could be a potential explanation for the record-breaking warmth?”
“This question was a focus at the 2024 annual American Geophysical Union (AGU) meeting in Washington, D.C., where 30,000-plus scientists gathered to present their latest research. The two leading theories to explain the record-breaking warmth are:”
A reduction in tiny particles in the atmosphere called aerosols due to shipping fuel regulations that reduced sulfur oxide (SOx) emissions.
Decreasing cloud cover.
In the first scenario the current warming curve is something like this.
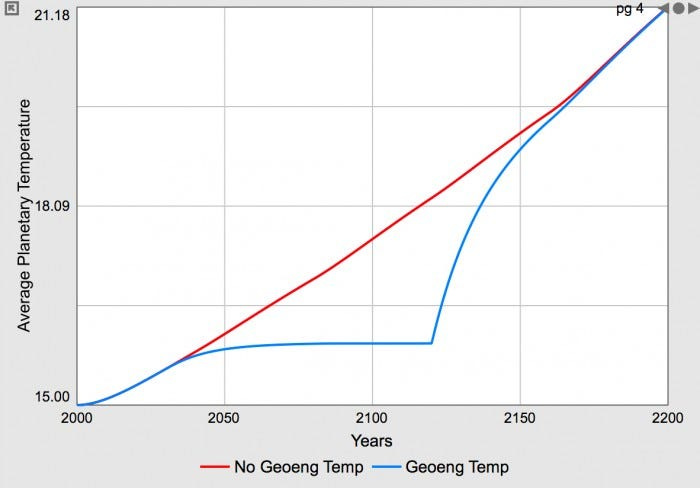
Hansen thinks it will reach the end of that warming curve with a jump in the GMST somewhere between +1.6°C and +1.7°C.
In 2021, a La Nina year, the official IPCC number for warming was +1.1°C.
Hansen expects 2025 to hit +1.7°C or just a bit under.
With a Rate of Warming of +0.36°C per decade going forward.
Meaning +2°C will be breached and SUSTAINED by 2035 and that’s “best case”.
Because we are STILL burning a LOT of coal and oil. Particularly when there is a massive surge in demand for electricity.
Like, when there’s a HEAT WAVE and people need air conditioning to survive.
Like LAST YEAR.
Like this year is going to be.
This is my analysis.
This is what I see.
This is my “Crisis Report”.
rc 03/26/2025
Addendum:
My next piece will take a look at the second scenario being proposed for the unexpected albedo dimming : Decreasing cloud cover. I wrote about this scenario in my 2022 article if you want to go and take a look at what I thought about it then. I asked.
Climate Report Part Three continued:….smokingtyger.medium.com
Is this about clouds?
When these experiments began two decades ago, many scientists expected that water in warmer seas would evaporate more quickly and create thicker clouds thereby reflecting more sunlight back into space. There was a common belief that the climate system would prove to have lots of “self-correcting” feedbacks.
But evidence was accumulating in the paleontological record that suggested when CO2 levels were high in previous periods — there were very few clouds. That warming from CO2 would create an amplifying feedback by reducing cloudiness instead of a dampening feedback of increasing clouds.
The debate over this point has been one of the main sources of uncertainty in modeling just how sensitive the climate is to increasing greenhouse gas concentrations.
Because clouds have a huge effect on the climate system.
Just a small change in their extent or reflectivity would have more of an impact than all the greenhouse gases released by human activities.
I also did a more recent revisit on clouds in this piece.
73 - You REALLY need to think about CLOUDS. Clouds in the present-day climate system cover approximately two-thirds of the globe. We may have REALLY fucked up. (05/11/24)
From May of 2024. Since then, there has been a burst of new papers on the topic.
So next time, we consider CLOUDS and consider just how BAD this could be.
Good post, Richard, as always. Thank you.
You seem to be heading for the idea of seeding the atmosphere with SOx (or equivalent technologies) to increase albedo and reduce temperatures. I suspect such a project is high on the Tech Bros list in America, not least to justify their continuing the use of fossil fuels. I am scared of the unknown consequences of such actions on the World's weather, but also recognise that if environmental catastrophe is inevitable, there will come a point when desperate measures will be tried.
On that basis, some years ago I devised a way of getting warm wet air into the atmosphere in large quantities and very cheaply (i used to invent things, with some success). At the time it was a project to create additional rainfall on African coastlines so that a coastal belt of trees could thrive long enough that they would, in turn, increase rainfall in the interior of the coastal countries (As happened in Les Landes in France in the 1800's).
But I am still confused whether putting additional humidity into the atmosphere would act as a CO2 equivalent and raise temperatures, or increase albedo and reduce them. Your thoughts?
All that said, and as you already know, my feelings are that recent methane clathrate escapes in the Arctic and Antarctic are the signal the tipping point for massive methane clathrate releases because of warmer oceans has now been reached. I have realised that all the methane trapped undersea in sediments is in an uniquely delicate situation; it is held in place by water pressure and cold sea temperature that have been relatively constant for hundreds or thousand of years, and any variations have been tiny. In any location that didn't have sufficient pressure or cold enough water, the methane would already have been released. Whilst water pressure is still constant, the sea temperatures are rising, and rising faster in the Arctic and Antarctic. So ALL methane clathrates are on a hairline trigger, and the first indication of that will be with the increasing warmth in the polar seas. Like now, with recent announcements of major methane releases at sea in the Arctic and Antarctic.
So whilst I used to think that any future methane releases would track like CO2 releases, gradually over time, that is actually completely wrong. Once the seas increase in temperature by a small amount, that will trigger massive methane releases all across the globe, with immediate climate heating and more releases. A runaway feedback.
I suspect we will find out very soon.
We have a lot of correlational data because the causal process is at the edge of understanding. This suggests to me that we are still struggling to catch up in understanding what we have caused. It appears that tracking over the last twenty years has been consistently underestimating the composite temperature increase. Hansen is closest to reality with emerging hard data. But each year forces to wait, with bated breath, for the worse expectation to become reality.
If we see 2 degrees C in 2027-28 with our current political collapse, I cannot imagine the level of social insanity we will face. We have no historical records equivalent to this.