Let’s talk about what’s going on.
‘Cause 2024 is “Coming in HOT”.

Remember this graph from last year?

I keep coming back to this graph because it illustrates very clearly the “state of play” in the field of Climate Science. Consider how the “forecasts” are clustered into 3 distinct groups.

These three “clusters” represent the three “factions” in the field of Climate Science. Basically they can be labeled as:
Minimizers — Moderates — Alarmists
If you group “Denier Science” into the larger Climate Science “umbrella” then you have the full-spectrum of responses to the current “Climate Crisis” which is unfolding.
Deniers — Minimizers — Moderates — Alarmists
I want to talk about how each of these groups is responding to the INTENSIFYING Climate Crisis. Things are getting worse VERY QUICKLY now and, when the global harvest numbers start turning downward and food prices start soaring, this issue is going to suddenly become IMPORTANT to everyone.
Unfortunately we “SEE” what’s happening in VERY different ways. This “division” is preventing us from responding to the Crisis in a meaningful way.
I used to think we would have a “decade or two” to gradually come together and UNIFY culturally and globally around a HUMAN response to this challenge. I believed that as recently as 2021 (see On Politics: War by Other Means 02 and Living in Bomb Time — 15).
I no longer believe this. The CRISIS is here, NOW, and we are “not ready”. If you add my analysis to the “Climate Science Umbrella” it becomes.
Deniers — Minimizers — Moderates — Alarmists — Crim
I think that a complete COLLAPSE of global/modern/technological civilization could happen by 2035. That’s HOW BAD I think “Climate Change” is about to become.
SO.
Let/s start by looking at FACTS.

2023 was the HOTTEST year since we started keeping accurate measurements in 1850.
“2023 also appears to be among the warmest years in at least 100,000. There were simply no cities, no books, agriculture or domesticated animals on this planet the last time the temperature was so high.”
-Carlo Buontempo, director of the European Union Climate Monitor
2023 was the world’s warmest year on record, by far. — NOAA Jan 12,2024
NASA Analysis Confirms 2023 as Warmest Year on Record. — NASA/GISS Jan 12, 2024
See How 2023 Shattered Records to Become the Hottest Year. — NYT Jan 9, 2024
Copernicus: 2023 is the hottest year on record, with global temperatures close to the 1.5°C limit. — Copernicus Agency EU Jan 9, 2024
2023 was the hottest year on record — and even hotter than expected. — Science Jan 9, 2024
EVERYONE AGREES with THIS FACT.
The last nine years have ALL been ABOVE +1.0C.
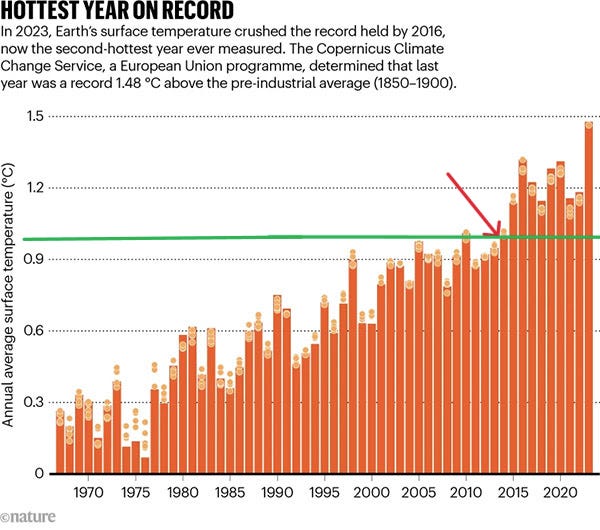

The last nine years have included ALL NINE of the warmest years observed in the instrumental record.
Global temperature in the GISS analysis increased +0.28°C in 2023, from 1.16°C to 1.44°C, the largest annual increase in the 144-year record.
2023 marks the first time on record that EVERY SINGLE DAY within a year exceeded +1°C above the 1850–1900 pre-industrial level. Close to 50% of days were more than 1.5°C warmer then the 1850–1900 level, and two days in November were, for the first time, more than 2°C warmer.
December 2023 was the warmest December on record globally, with an average temperature of 13.51°C, +0.85°C above the 1991–2020 average and +1.78°C above the 1850–1900 level for the month.
EVERYONE AGREES with THIS FACT.
So, 2023 was NOT “just a hot year”. The GLOBAL TEMPERATURE has been climbing RAPIDLY since about 2014.

Global Temperature Report for 2023 — Berkeley Earth Jan, 12 2024.
“2023 was a highly unusual year in several respects, including record warmth in most ocean basins and a large deviation from the historical trend.”
Warmth in 2023 greatly exceeded expectations, and was much stronger than normal this early in an El Niño.
“Some studies have recently argued that the pace of global warming may be accelerating.”
“However, given historical variability in surface temperatures, it still remains too early to conclude whether or not the pace of surface warming has increased.”
— Berkeley Earth 2024
EVERYONE AGREES that 2023 was “Crazy Hot”. The BIG questions are.
WHY it got so much “hotter than expected”?
HOW MUCH will this next “STEP UP” the “heat ladder” take us?
Is the RATE of WARMING Accelerating?
The MOST IMPORTANT thing to understand is that we HAVE accurate measurements of the AMOUNT of HEAT going into the OCEANS. Using the ARGO network of automated observation floats we have comprehensive “real time” information on the amount of HEAT in the OCEANS and how FAST it is INCREASING

WE KNOW HOW MUCH HEAT IS GOING INTO THE OCEANS.
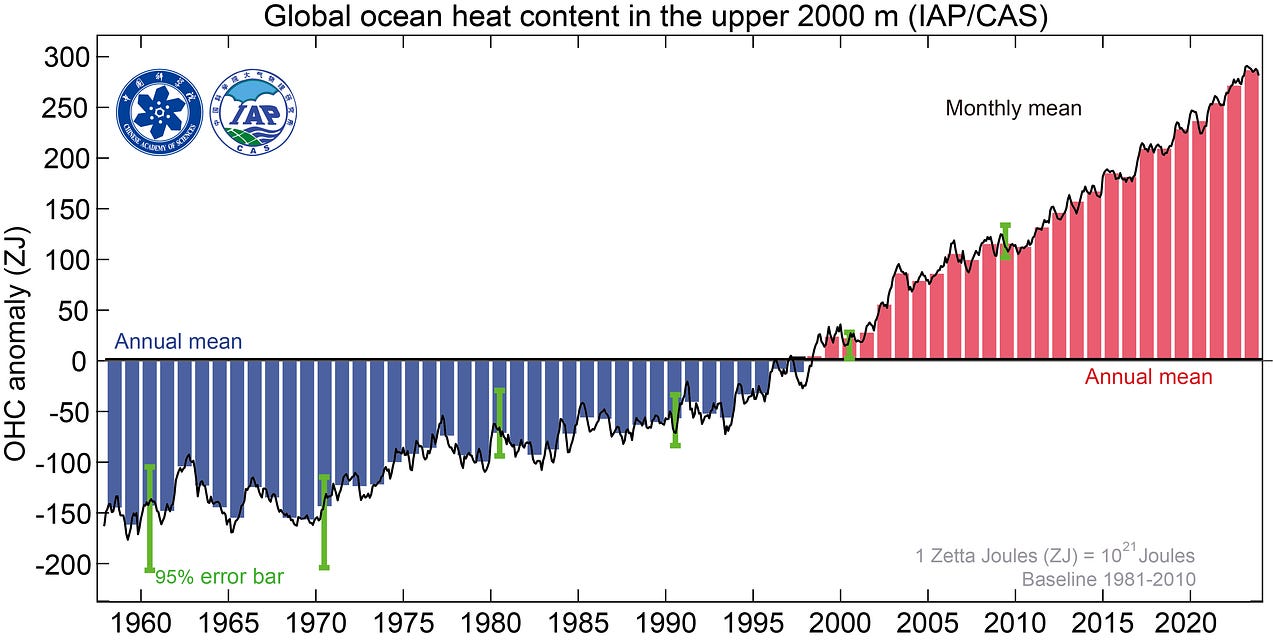
Here’s a different way of “seeing” how the Oceans have RAPIDLY WARMED.

See how much the “uncertainty” about the HEAT CONTENT in the Oceans vanishes when the ARGO float system went online in 2005.
Thanks to the ARGO floats, for the first time, we can actually measure just HOW FAST the Earth is ACTUALLY warming up.
In the graph above, the “ANNUAL RATE of HEAT added to the OCEANS per Decade” is shown. I found this somewhat confusing at first but it works like this.
1960–1970 Rate: +2.7(ZJ) per Year × 10 = +27(ZJ) of Warming.
1970–1980 Rate: +5.8(ZJ) per Year × 10 = +58(ZJ) of Warming.
1980–1990 Rate: +2.6(ZJ) per Year × 10 = +26(ZJ) of Warming.
1990–2000 Rate: +6.7(ZJ) per Year × 10 = +67(ZJ) of Warming.
2000–2010 Rate: +10.2(ZJ) per Year × 10 = +102(ZJ) of Warming.
2010–2020 Rate: +13.0(ZJ) per Year × 10 = +130(ZJ) of Warming.
Total HEAT ENERGY added to the Oceans 1960–2020 = +410(ZJ).
All “credible” Climate Science papers roughly agree on these numbers.
EVERYONE EXCEPT “DENIERS” agree with these measurements.
I mean, what the fuck is the point of doing measurements if you aren’t going to “believe” in the one’s that prove your THEORIES and MODELS were wrong.
So, we can say, with a HIGH DEGREE of CONFIDENCE.
The HEAT in Global Ocean increased by about +15 Zetta Joules between 2022 and 2023. +15ZJ in ONE YEAR.
“The report finds that about 90% of the energy trapped in the climate system by greenhouse gases goes into the ocean and that ocean heat content, which measures this gain in energy, reached a new observed record high in 2022.”
That record, lasted all of 1 year.
Oceans break heat records five years in a row
The heat stored in the world's oceans increased by the greatest margin ever in 2023. The heat stored in the world's…
The findings are the latest update of an annual study led by the Institute of Atmospheric Physics (IAP) at the Chinese Academy of Sciences in Beijing. These researchers say that the oceans have been warming at “record breaking” rates EVERY YEAR since 2019.
FYI- A total of 34 scientists from 19 research organizations in 5 countries participated in the research.
Here is the same data in a 2022 graph from NOAA’s Oceanography Institute. What do you “see”?
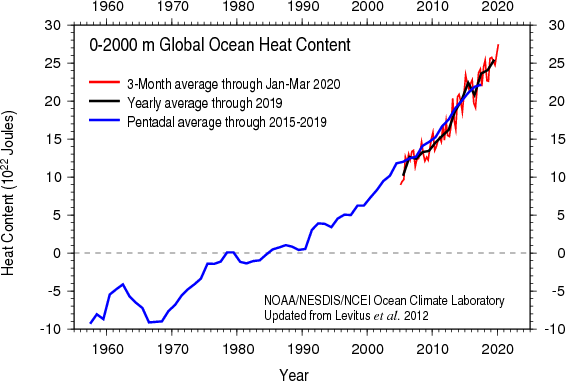
Again, from the recent paper.
New Record Ocean Temperatures and Related Climate Indicators in 2023
Original Paper, Open access, Published: 11 January 2024
ABSTRACT:
“The global physical and biogeochemical environment has been substantially altered in response to increased atmospheric greenhouse gases from human activities.”
In 2023, the sea surface temperature (SST) and upper 2000 m ocean heat content (OHC) reached record highs. The 0–2000 m OHC in 2023 exceeded that of 2022 by 15 ± 10 ZJ (1 Zetta Joules = 1021 Joules) (updated IAP/CAS data); 9 ± 5 ZJ (NCEI/NOAA data).
The Tropical Atlantic Ocean, the Mediterranean Sea, and southern oceans recorded their highest Ocean Heat Content (OHC) observed since the 1950s.
Associated with the onset of a strong El Niño, the global Sea Surface Temperature (SST) reached its record high in 2023 with an annual mean of +0.23°C higher than 2022 and an astounding > 0.3°C above 2022 values for the second half of 2023.
The density stratification and spatial temperature inhomogeneity indexes reached their highest values in 2023.
There is something REALLY IMPORTANT here that you NEED to NOTICE.
Did you notice the BIG difference between the “American” data and, basically, the rest of the WORLD.
Here are the TWO main “camps” in Climate Science expressing HOW MUCH “heat energy” they think was added to the Oceans in 2023.
15 ± 10 ZJ (1 Zetta Joules = 1021 Joules) (updated IAP/CAS data) — Everyone Else
9 ± 5 ZJ (NCEI/NOAA data) — NASA/GISS and NOAA/NCEI
The DIFFERENCE between these two numbers is SIGNIFICANT. The AMERICAN “estimate” is about -35% LOWER than everyone else.
WHY?
From the article “Oceans break heat records five years in a row. The heat stored in the world’s oceans increased by the greatest margin ever in 2023.”
“Cheng and his co-authors studied two data sets on ocean heat content: one from the IAP and the other from the National Centers for Environmental Information (NCEI) at the National Oceanic and Atmospheric Administration of the United States.”
The IAP data show that the heat stored in the upper 2,000 metres of oceans increased by +15 zettajoules in 2023 compared with that stored in 2022.
This, is an ENORMOUS AMOUNT of energy.
Most people have NO CONCEPT of how to VISUALIZE that number in a “relatable” MEANIGFUL WAY.
How to “see” 15(ZJ) worth of ENERGY.

+15 Zetta Joules in ONE YEAR!
A Zetta joule is a joule (the work it takes to make a watt of power for a second) with 21 zeros behind it. Thats 1,000,000,000,000,000,000,000 joules.
Unfortunately that number is “unreal” to most people. It’s hard to FEEL what it means.
Which is why it is often expressed in terms of HIROS. Which is short for Hiroshima class atomic bombs.
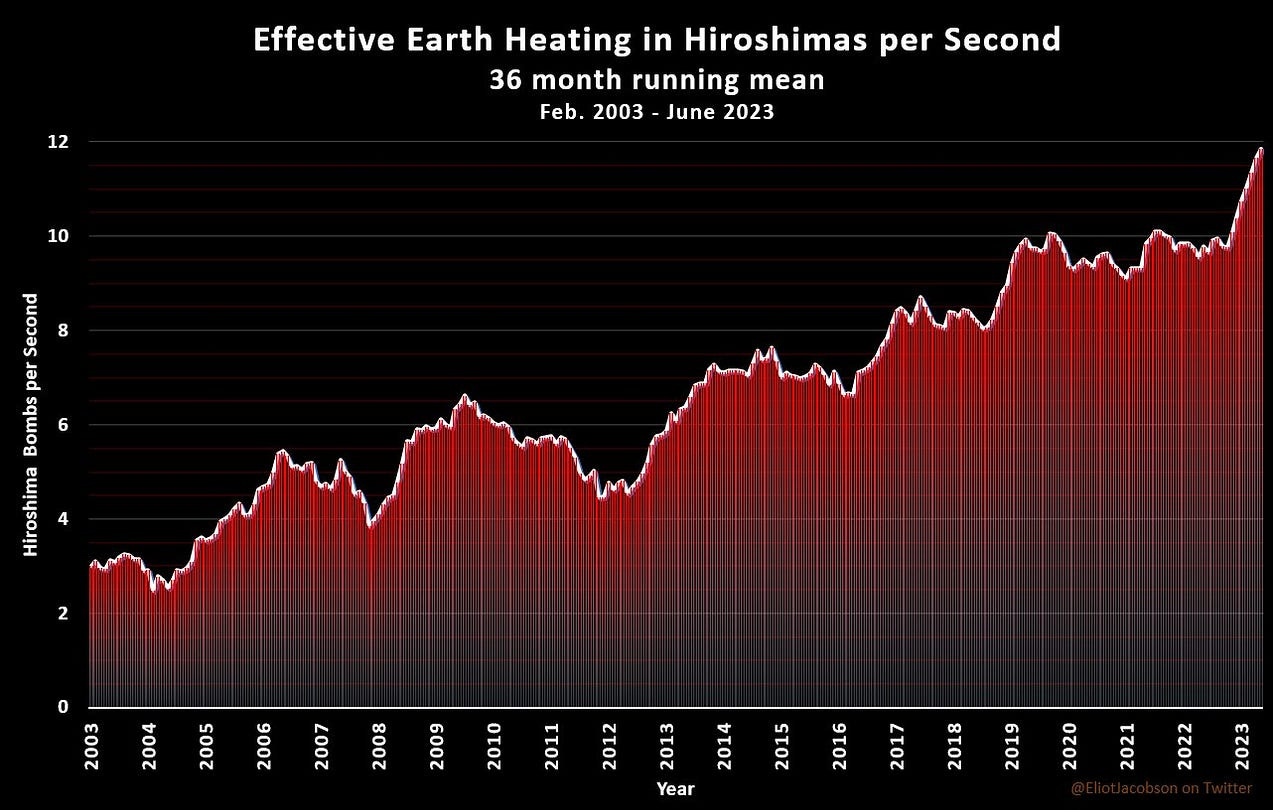
In 2010 the ENERGY flow into the Oceans was about 5 HIROS per SECOND.
The EEI (Earth Energy Imbalance) has increased from +0.5W/m2 in 2010, to +1.4W/m2 in 2023. Basically TRIPLING.
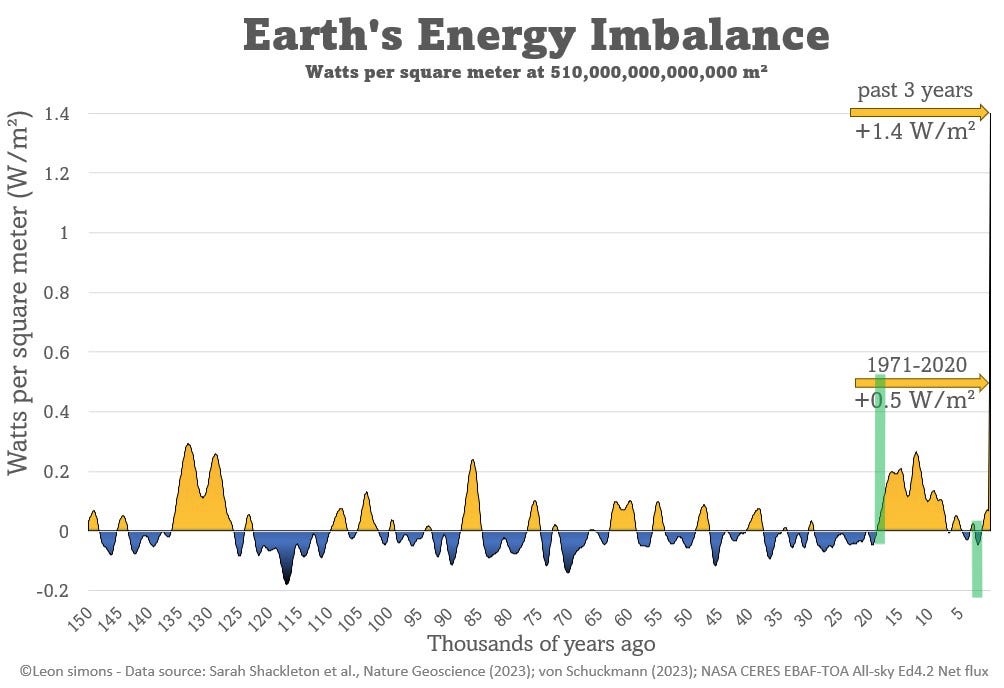
Hansen says this. Global Warming Acceleration: El Nino Measuring Stick Looks Good.
(Nov, 14 2023) James Hansen, , Makiko Sato, Reto Ruedy
Berkeley Earth says this. Global Temperature Report for 2023.
Posted on January 12, 2024 by Robert Rohde
The NASA CERES data says this.
The EEI has TRIPLED since 2010. There is NO QUESTION about that. It’s a FACT.
That’s a FLOOD of ENERGY into the Climate System.
90% of it goes into the OCEANS.
Global Warming is OCEAN WARMING after all.
SO.
In 2010 the ENERGY flow into the Oceans was about 5 HIROS per SECOND.
In 2023 the ENERGY flow into the Oceans was about 15 HIROS per SECOND.
That’s 900 Hiros per minute.
54,000 Hiros per hour.
1,296,000 Hiros per day.
473,040,000 Hiros per year.
The surface area of the global ocean is 139,000,000 square miles.
That’s 3.4 HIROS for EVERY SQUARE MILE of OCEAN in the WORLD last year.
That’s what +15 ZJ means.
It’s easier to viscerally FEEL what a large number MEANS. When you can visualize it against something relatable.
Everyone understands what an atomic blast looks like and does.
There’s nothing ABSTRACT about it.
Now you have a handle on how much HEAT is building up in the Oceans. Now it MEANS something to you.
For comparison, the world’s total energy consumption in 2022 was roughly 0.6 zettajoules.
+15(ZJ) was the “Non-American” figure for how much the Oceans WARMED UP in 2023.
NOAA/NCEI’s figure for the 2023 increase is +9 zettajoules.
The discrepancy between the two figures is caused.
By the different calculation (MODELS) and “data quality-control methods” used by the organizations (ie. NASA/NOAA casting DOUBT on everyone else’s work without proof).
But,
“the important point in the paper and for scientific understanding is that the ocean is warming consistently, year over year, to new record levels of ocean heat content”,
Says Tim Boyer, an oceanographer with the NCEI and one of the paper’s co-authors.

In this article it’s clear that they are trying to “paper over” the difference in these two positions.
The American/s are basically saying.
“We ALL agree the Oceans are RAPIDLY WARMING. That’s the MOST important thing. We just think that the ‘Chinese Science’ has ‘quality-control’ issues and is overstating the severity of the problem.”
Remember this graph?
This is NOT something you can ignore or shrug your shoulders and say “the science is unsettled”. The DIFFERENCE between the “MINIMIZER” models and REALITY is GROWING.
Listening to what NASA/GISS and NOAA are forecasting is becoming DANGEROUS.
End Part One.
This is my analysis.
This is what I see.
This is my “Crisis Report”.
— rc 01162024
Personal Notes:
If you didn’t catch it, I did a video interview with Max Rottersman for his YT program. We talked about Climate Change for over an hour but he edited down to about 20 minutes.
If you want to see\hear me talk/lecture/ramble for 20 minutes here’s the link.
This piece was HARD to write. Things are happening FAST with the Climate System and NONE of it is GOOD.
Literally, papers are coming out almost daily.
I am trying to avoid saying that the situation is APOCALYPTIC and so I am presenting as many viewpoints as I can. As I noted, most of what’s being put out falls along this spectrum.
Deniers — Minimizers — Moderates — Alarmists — Crim
Assigning examples to each of these groups gets us this range of “sources” to compare\contrast.
Deniers — I was going to say David Siegel but apparently he got kicked off Medium last October. Which kinda shocks me. David had something like 15K followers the last time I read one of his pieces. 10X MORE than ME (on Medium) if you want to compare our “impact” in those terms.
I was kicked off Medium.com for reporting science - Shortfall
www.cuttingthroughthenoise.net
Go check out his site if you want to know what the DENIERS are saying.
Minimizers — NASA/GISS, NOAA, and Michael Mann.
Moderates — Berkeley Earth.
Alarmists — Hansen.
In the next few papers I will outline what I think is happening and how BAD the next years are going to be. Keep in mind, I think it’s WORSE than any of these guys.
And I say again.




Your point on the spectrum that you label "Crim" might better be labelled "Realists", or more accurately "Hopeful optimists".
We passed Apocalyptic two decades ago. I am pretty sure we passed the point of no return back before Carter was elected President. And I believe the sign post back then said something about last exit before the mass extinction, as well as - next stop 'the end of everything you know'.
The atmosphere and the oceans are continuing to destabilize.
In the atmosphere, the loss of the bulk of the thermal driving force at the north pole with the melted ice, combined with the overheated oceans and equator, have reduced the strength of the polar vortex (the northern jet) and the main jet stream at the Hadley-Ferrell junction. As a result, we are having massive excursions of heat moving north and cold moving south.
This peaks with the thermodynamic breakdown of the Earth's heat engine, and the chaotic and rapid shift to a unicellular atmospheric circulation. With that not only do we have weather chaos, we also have loss of the rain bands at 45 north. That leads to loss of agriculture.
Funny thing, people are addicted to eating. When they go without food for months at a time, they tend to become peckish snd grumpy.
Plus they have this tremendous addiction to water. Take that away and the whining just gets obnoxious.
Combine this with the collapse of the AMOC and the Pacific oscillation, and things get a bit concerning.
Large anoxic zones and vortexes develop in the oceans and at coastal margins and shorelines. Then fishermen get annoyed when the oceans die like that and it bites into their profit margins,
The folks living on the coasts won't be very pleasant either, what with all their grumbling about rotten eggs as the oceans die and rot, and the purple bacteria produce prodigious quantities of hydrogen sulfide rather than oxygen. They also get really upset about the whale carcasses littering the beach.
Your ever so generous allowance of 12 years before things get seriously troubled is a bit annoying. That is sooner than my expected lifespan expires. I was planning on a graceful exit before the excrement encountered the rotating air mover.
Oh well. Maybe the pandemic-that-shall-not-be-named may aid us.Cough. Cough. It's just a cold.
We're all gonna die!!!!