The Crisis Report - 54
Unclothing the Emperor : Understanding “What’s Wrong” with our “Climate Paradigm”. Part 3 - Latitudinal Gradient Response and Polar Amplification.

In case you missed it in James Hansen’s latest paper, How We Know that Global Warming is Accelerating and that the Goal of the Paris Agreement is Dead, here’s the most important takeaway from the paper.
“A decade ago, we estimated that Earth Energy Imbalance (EEI) during the first decade of this century was +0.6 W/m2 averaged over the planet, which is about 16 times greater than humanity’s total (annual) energy use and equal to the energy of 400,000 Hiroshima atomic bombs per day.”
“However, since then, fossil fuel emissions have not declined; instead, they have grown, and Earth’s energy imbalance has approximately doubled.”
Due to our Climate Forcings, about 800,000 Hiroshima bombs worth of ENERGY is being added to the Global Ocean PER DAY.
That/s Two Hundred and Ninety Two Million (292,000,000) Hiro/s worth of ENERGY going into the Oceans per year.
The surface area of the world’s oceans is roughly 139 million square miles.

Due to our Climate Forcings, about 2.1 Hiro/s worth of ENERGY is being added to EVERY SQUARE MILE of Ocean on Earth, EVERY YEAR.
If this ENERGY was being absorbed by the atmosphere instead of the oceans, our planet would be a burned and blackened cinder in space.
According to the Current Climate Paradigm in Climate Science, that of the MODERATES, this isn’t supposed to be happening.
Sadly, they are the ONLY voices we have been listening to for the LAST 25 YEARS. Because, they got EVERYTHING WRONG.
— — — — — —
1896
Svante Arrhenius calculated that doubling atmospheric CO₂ concentrations would result in a total warming of 5–6°C. His work was published in the study titled “On the influence of carbonic acid in the air upon the temperature of the ground”
The very FIRST scientist to look at this question, used measurements on the heat trapping capacity of CO2 from greenhouses. He then extrapolated those findings to the WHOLE atmosphere. And, using just paper and pencil, he produced this estimate of the Earth/s “Climate Sensitivity”.
Which agrees with what the paleoclimate record indicates.

The implications of this are PROFOUND and generally ignored.
BECAUSE-
Svante’s estimate is based strictly on “the physics” of the Climate System. He is looking at it in the most STRIPPED DOWN way possible and his calculations produced an answer the fossil record indicates is CORRECT.
The implication is that ALL of the OTHER STUFF we have been arguing about, is trivial compared to that. If you can ignore all of the other influences and get to the RIGHT ANSWER using just the variables Arrhenius used, those are the MOST IMPORTANT variables.
Meanwhile, his colleague, Arvid Högbom, was attempting to quantify natural emissions of CO₂ to gain a better understanding of the global carbon cycle. During his investigations, Högbom found that the estimated carbon production from industrial sources in the 1890s, primarily from coal burning, was comparable to natural sources of CO₂ emissions.
1998
Latitudinal temperature gradients and climate change.
JOURNAL OF GEOPHYSICAL RESEARCH, VOL. 103, NO. D6, PAGES 5943–5971, MARCH 27, 1998 by David Rind NASA\GISS
An obvious goal (of future studies) would be to clarify gradient changes by improving the quality and geographic distribution of paleoclimate observations and the representation of physicalast l processes, particularly convection, sea ice, and ocean circulation, in GCMs (Global Climate Models) for future prediction.
“If we knew what to expect, it might be possible to infer changes in the latitudinal temperature gradient from observations already available.” -David Rind NASA/GISS Researcher Emeritus, 1998

As much as this paper was a “response” by the Moderates to the PROBLEM of the PETM Arctic fossils (alligators and palm trees in Northern Greenland 53mya). It/s not titled, “Implications of the High Arctic Fossil Record on Estimates of Climate Sensitivity”. That’s a secondary issue in this paper.
This paper is about the “Latitudinal Equator to Pole Temperature Gradient”.
If you are wondering what the “latitudinal temperature gradient” is, and why it’s important. Remember Rind’s statement at the beginning of the paper.
“How variable is the latitudinal temperature gradient with climate change?”
“This question is second in importance only to the question of overall climate sensitivity”
SO, WHAT IS THIS ABOUT, and WHY IS IT IMPORTANT?
-– — — — — — — — — — — — — — — —
UNDERSTANDING THE LATITUDINAL EQUATOR TO POLE TEMPERATURE GRADIENT” (LEtPTG) : The Basics.
Let’s start with 3 basic PHYSICAL FACTS about our planet.
The Earth is tilted on its axis.
2. 80% of the Solar ENERGY captured by the Earth in its orbit, happens at the Equator.

3. Because of 1 & 2 the two POLAR zones ALWAYS exist in states of ENERGY DEFICIT. It’s why they are “cold”, they lose more ENERGY to Space during their Winter months than they take in during the Summer months.
In the Climate System, ENERGY starts at the EQUATOR and flows towards the two POLES.
The permanent ENERGY IMBALANCE between the HOT EQUATORIAL ZONE and the COLD POLAR ZONES results in a CONSTANT flow of HEAT ENERGY from the equator to the poles using the oceans and the atmosphere. This FLOW of ENERGY is what we perceive as “weather”. The long-term state of the ENERGY IMBALANCE between the equator and the poles is what we perceive as “climate”.
Everything else is details.
We live on two different planets. The Northern Hemisphere and the Southern Hemisphere.
Because of the difference in the amounts of land in each hemisphere, they process the ENERGY from the Equator VERY differently.
The Northern Hemisphere is dominated by landmasses.
The Southern Hemisphere by oceans.
The North Pole is a shallow “basin ocean”.
The South Pole is a mile high plateau at the center of a large continental landmass.
Although the two hemispheres are “coupled” and interact, they are really like two separate planets.

The South Pole is MUCH colder than the North Pole.
The differential between the EQUATOR and each POLE is consistent and there is a GRADIENT in the temperatures between those points. That’s what the LEtPTG measures. It’s REALLY important but in a non-intuitive way.
The North Pole Gradient from 1950–1980 was roughly -45C.
Meaning that if it’s +25C (77F) at the Equator, you would expect it to be around -20C (-4F) at the North Pole.
The South Pole Gradient from 1950–1980 was roughly -80C. The SP is MUCH COLDER.
Meaning that if it’s +25C (77) at the Equator, you would expect it to be around -55C (-67F) at the South Pole.
When Rind asked in 1998,
“How variable is the latitudinal temperature gradient with climate change”
These curves are what he was talking about.
— — — — — — — — —
NOW, HERE’S THE “FATE of CIVILIZATION” QUESTION.
SO, pay attention.
What happen/s at the POLES when you slam more HEAT in at the EQUATOR, what effect does that have on the LEtPTG?
Because a LOT of that extra HEAT is going to end up at the POLES.
Thermodynamics and the axial tilt of the planet dictates that outcome. HEAT always flows from the EQUATOR to the POLES. So, what happens when the EXTRA HEAT in the Climate System gets to the POLES?
In 1998 there were 3 main “theories” about the North Pole.
The NP would just ‘eat’ the extra HEAT ENERGY. — DENIERS
The temperature at the NP would go up, “slightly”. — MODERATES
The temperature at the NP would go up, “A LOT”. — ALARMISTS
What was starting to scare Moderate Climate Scientists in 1998, was that they had believed the answer would be #1 or #2. But the new fossil evidence, indicated it might be #3.
Here are Rind’s conclusions.
“Future climate projections from different (Climate) models show substantial differences in the projected latitudinal temperature response from anthropogenic greenhouse perturbations”.
This is due to the different estimates about Climate Sensitivity. If you think 2XCO2 (doubling atmospheric CO2) is going to raise the Global Mean Temperature by +2C, you get a VERY different answer than if you think it/s going to raise the GMT by +4C.
Doubled CO2 equilibrium simulations from different atmosphere-mixed layer ocean models show different degrees of high-latitude climate warming amplification.
In the GFDL model (Alarmist), the temperature response at high latitudes is 3–4 times that at the equator.
While in the GISS model (Moderate), it is only close to a factor of 2 [Rind, 1987a].
The regional response in these different models depends on these differences in equator-to-pole gradients, which affects the hydrologic cycle, in general, and storm energetics [Rind, 1987a, 1988].
Translation — EVERYTHING, “kinda” depends on how this works.
Rind and NASA/GISS had a CHOICE here. Between an ALARMIST model they didn’t “agree” with, and their model which produced results in-line with their expectations.
They picked their own model. What did you think would happen?
That was very influential. NASA/GISS is regarded as the “Gold Standard” in Climate Science. It became an accepted FACT that this would be the “expected” amount of “Arctic Amplification”.
High-Latitude Climate Warming Amplification should ONLY be “close to a factor of 2”.
Here’s what that would look like according to the Moderate Climate Paradigm.
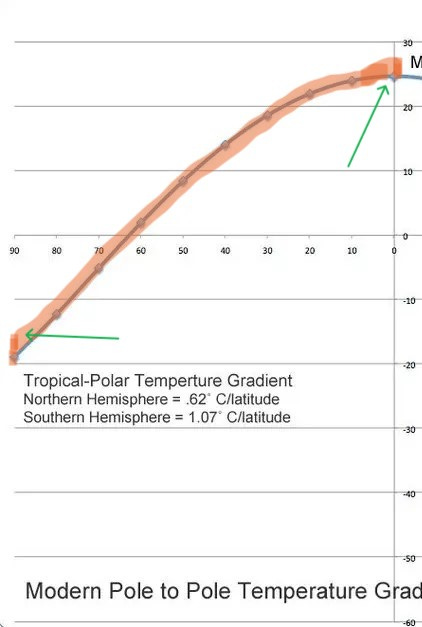
This is the ASSUMPTION that our Climate Models have been using for the last 25 years.
NOW seems like a good time to REVISIT that ASSUMPTION. Particularly now that we KNOW the Alarmists were right.
— — — — — — — — — — — — -
Because the Arctic is warming a LOT faster than the rest of the Earth. Just the way the Alarmist Models said it would, back in 1998.
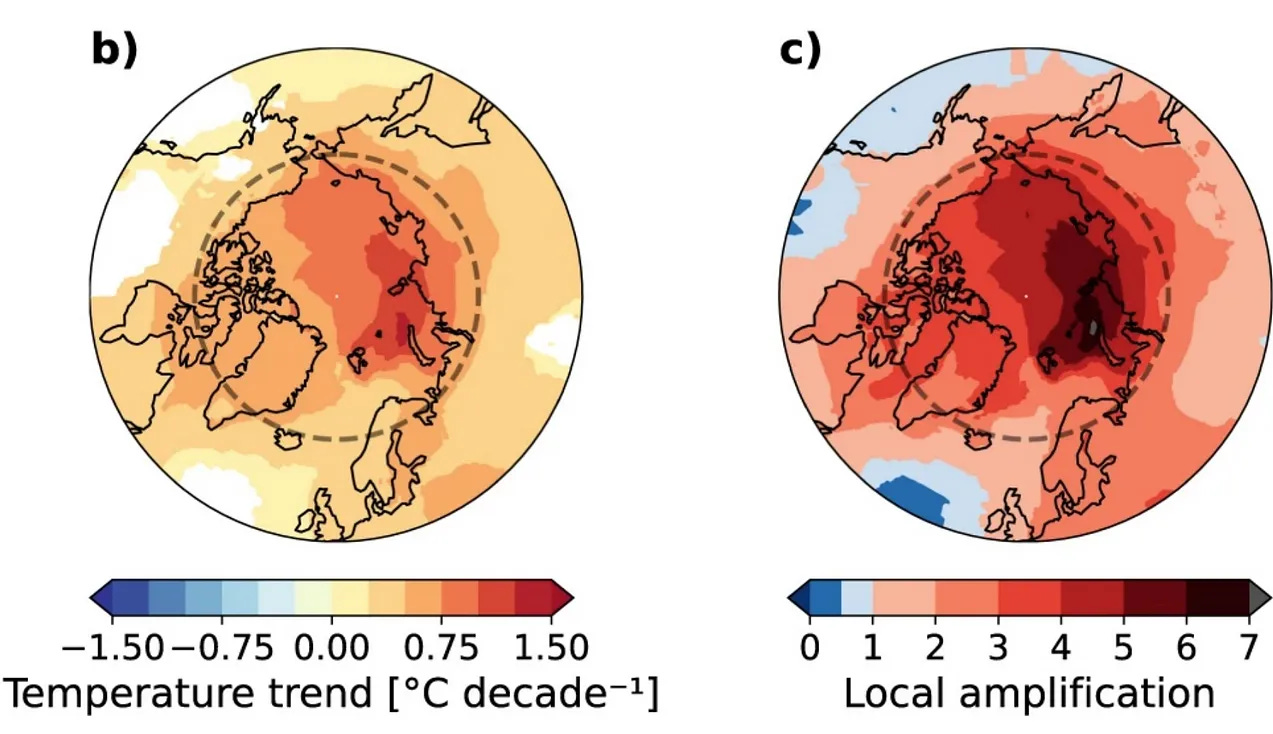
The Arctic has warmed nearly four times faster than the globe since 1979
Communications Earth & Environment volume 3, Article number: 168 (Aug 2022)
In recent decades, the warming in the Arctic has been much faster than in the rest of the world, a phenomenon known as Arctic amplification.
Numerous studies report (based on models) that the Arctic is warming either twice, more than twice, or even three times as fast as the globe on average.
Here we show, by using several observational datasets (REAL collected DATA) which cover the Arctic region.
That during the last 43 years the Arctic has been warming nearly four times faster than the globe, which is a higher ratio than generally reported in literature.
We compared the observed Arctic amplification ratio with the ratio simulated by state-of-the-art climate models, and found that the observed four-fold warming ratio over 1979–2021 is an extremely rare occasion in the climate model simulations.
The observed and simulated amplification ratios are more consistent with each other if calculated over a longer period; however the comparison is obscured by observational uncertainties before 1979.
Our results indicate that the recent four-fold Arctic warming ratio is either an extremely unlikely event, or the climate models systematically tend to underestimate the amplification.
Yah think?
NASA/GISS TOLD everyone in 1998 to use a LOW value for Amplification and so EVERYONE did. EVERYONE assumes that NASA/GISS knows what they are talking about.
No one questions the “scientific consensus” because if you do, why then, ‘you’re a DOOMER’.
So, ALL of our MODELS and FORECASTS are built on MASSIVELY FLAWED THEORIES that UNDERESTIMATE the “second most important aspect” of the Climate System.
Here’s the question that should keep you up after you read this.
How MUCH will the High Arctic warm in response to the ENERGY flowing into it?
We can SEE that it warms about +4X FASTER than the Equatorial Zone.

So, how much HEAT will ACCUMULATE before the Equator and the High Arctic reach a NEW EQUILIBRIUM?
“If we knew what to expect, it might be possible to infer changes in the latitudinal temperature gradient from observations already available.” -David Rind NASA/GISS Researcher Emeritus, 1998
It took awhile for the paleoclimate research to come in. Digging up “hard” evidence takes a LOT longer than creating THEORIES and MODELS out of “thin-air”. Rind’s 1998 dismissal of the use of paleoclimate data as “highly speculative” meant that works like this.
Some Thoughts on Global Climate Change: The Transition from Icehouse to Hothouse Conditions
From book: Earth History: The Evolution of the Earth System (2016)
Largely went unnoticed by the time they were published. Which is unfortunate.
Because it tells us “what to expect”.

Spoiler Alert: We “guessed” WRONG.
— — — — — — — —
This has been a LONG series of posts covering a LOT of ground. 1998 was a “pivotal moment” in Climate Science and in our Social Response to the Fossil Fuel Problem. We didn’t understand the Climate System very well and we made some BAD choices.
THIS IS REALLY IMPORTANT.
I am trying to HAMMER that into your ATTENTION. It’s THE most important thing to understand about what’s happening to our world.
It’s why COLLAPSE is going to happen “faster than expected”.
Because, if we get the +4C of warming that the paleoclimate record indicates.
The High Arctic will WARM by at LEAST +16C.
How long do you think that will take?
We used to think warming like that would take hundreds of years, even millennia.
Siberia has warmed between +7C and +8C since 1979. Around +2C per decade.
The RATE of WARMING has DOUBLED since 2015.
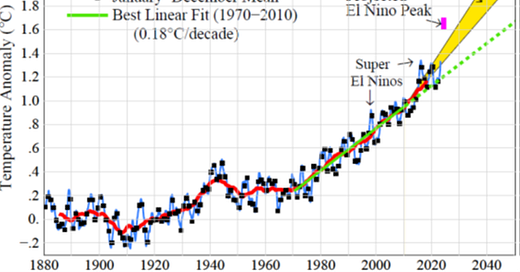
However, since then, fossil fuel emissions have not declined; instead, they have grown, and Earth’s energy imbalance has approximately doubled (Fig. 3).” - Hansen 11/10/23

Siberia could warm another +8C in 20 to 30 years. Easily by 2050.
The rest of the High Arctic will warm about +4C to +6C during that time.
This will have SEVERE CONSEQUENCES and it’s the BEST CASE.
Here’s what the paleoclimate research indicates about how the Climate System really works.
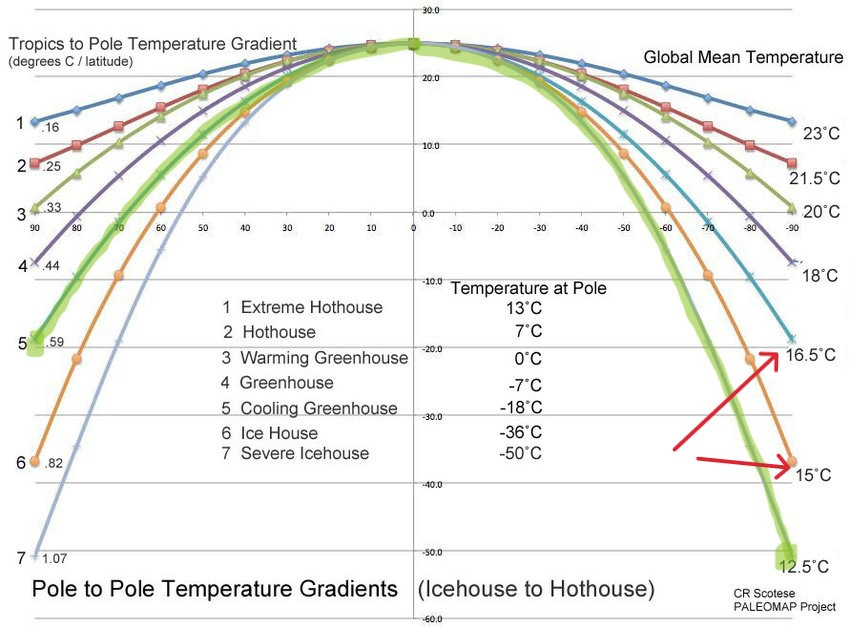
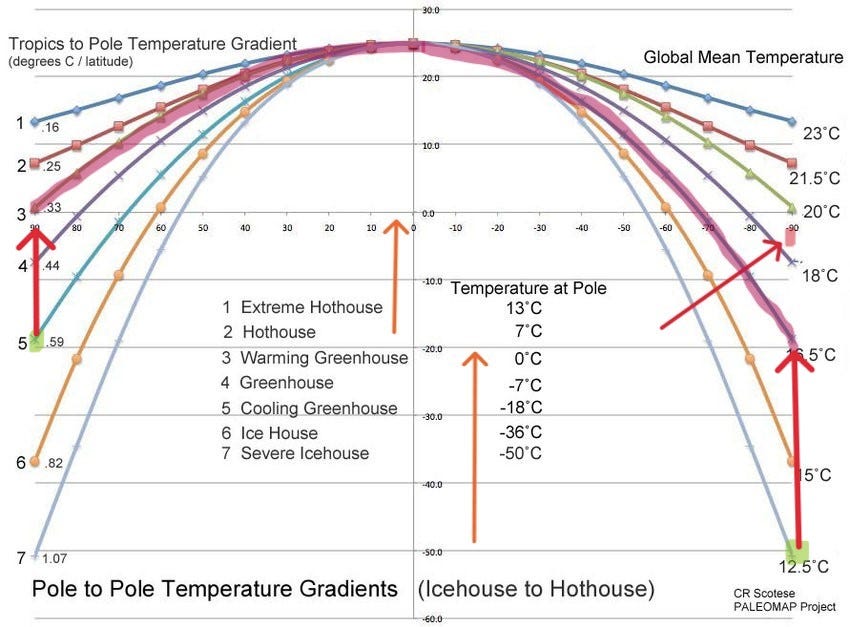
In this graphic there are seven different “climate states” shown for a variety of different periods of the Earth. The Tropics-to-Pole Temperature Gradient is shown for each of these climate states, in both of the two hemispheres.
The way to use the graph, is to pick the state each of the poles is currently in and average the results to get the Global Mean Temperature of the planet. We are currently in a 5/7 configuration, so the GMT should be around 15C (59F). Which, of course, is the current GMT.
Now, what happens if we dump enough CO2 into the atmosphere to raise the GMT by +4C? The amount of warming the paleoclimate record indicates we can expect at a CO2 level of around 400ppm.
At the North Pole temperatures go up about +20C.
Shrinking the difference between the Equator and the NP from -45C to just -25C. Meaning, that if is 77F at the Equator we would expect it to be about 32F at the North Pole.
This is what the “near term” future of the Arctic looks like. It’s a LOT hotter than the rest of the planet.

What the paleoclimate data indicates, is that an “avalanche of heat” is in the process of raising the High Arctic temperature by about +20C.
If that seems “far fetched” to you, remember the High Arctic has ALREADY warmed about +4C ON AVERAGE. Parts of it have warmed +7C.
Around 2015 the RATE of Warming jumped up again. Per Hansen, we know that the EEI roughly doubled. It went from about +0.24C per decade to AT LEAST +0.36C per decade. AT THE EQUATOR.
In the High Arctic that’s going to mean temperature increases of +1.5C per decade on average. With Siberia warming at about +2.5C PER DECADE.
At that rate, the High Arctic and the rest of the world will start to reach a +4C equilibrium, around 2125. Or, in roughly 100 years.

This isn’t the “far future” anymore. This is where we are probably headed in about 100 years. Possibly less.
Because, the WARMING of the High Arctic is going to have SEVERE consequences for the entire planet.
It’s probably going to melt ALL of the Northern Permafrost.
The cascade of “tipping points” this triggers, will probably warm the Earth an additional +3/+4C when Climate/Thermal Equilibrium is reached.
That’s a BIG part of how Hansen gets to a possible +10C in his analysis.
Global warming in the pipeline.
I just think it’s going to happen a LOT faster than Hansen does.
The “Permafrost Melt” that’s started, it’s about to affect your life. Because Permafrost covers 24 percent of the land area in the northern hemisphere and accounts for nearly half of all organic carbon stored within the planet’s soils.
Because now, we live in Bomb Time.
Bomb Time — The hyper accelerated rate of warming and climate change that will compress 1,000 years of normal inter-glacial warming into the next 20 years of human time as the thermal pulse from our “climate bomb” hits the planet.
This is my analysis.
This is what I see.
This is my “Crisis Report”.
rc 11172023
Previous Parts:
Unclothing the Emperor : Understanding “What’s Wrong” with our Climate Paradigm. In order to understand “Why” things are happening “FASTER than Expected”.
Unclothing the Emperor : Understanding “What’s Wrong” with our “Climate Paradigm”. Part 2
Hansen dropped a new paper on Friday morning (11/10/23). Let’s UNPACK what it MEANS.
Index to my Articles on SubStack




If I may with all due respect, I request (beg) that you please also put the Fahrenheit equivalent throughout your articles where you reference temperature. From a reader perspective with US math, it puts a hard stop in the contextual flow as we have to mentally convert each time - which you may think oh well big deal, but it truly takes away from the impact … and not particularly requesting for me, but for those that don’t get it or that are new to understanding… anyway, thank you for your work.
The number of times I find myself shaking my head in disappointment/disbelief/disgust while reading these posts… I’m surprised my head doesn’t fling off. Thank you for another informative article.