The Crisis Report - 53
Hansen dropped a new paper on Friday morning. Let’s UNPACK what it MEANS.

SO.
If you have been reading my stuff for awhile you know that last February (2022) I wrote this paper.
Climate Report Part Three continued: Heat doesn’t “just happen”. Where it’s coming from and why that matters.
It was the last piece of a 5 part report on the “State of the Climate System 2022”. I think it has held up well for something nearly two years old. Here are the other parts.
If we are going to have meaningful votes on Climate Change policy, people need to understand it. Right now, that’s not easy.
Living in Bomb Time — 17 : Climate Report: Part Two.
How much has the Earth warmed up since the “preindustrial” period?
Surprisingly it’s hard to get a straightforward answer to that question.
Why?
Living in Bomb Time — 18 : Climate Report, Part Three.
Global Warming accelerated between 2010 and 2020, if it continues, it’s catastrophically bad news.
Living in Bomb Time — 19 : Report Addendum.
Consider the Earth’s Oceans, that’s where all the heat goes. Global Warming is Actually “Ocean Warming”. That’s why they’re dying.
IT'S a LOT to READ.
I bring this up because I want to “compare and contrast” my paper from February 2022 with Hansen’s newest paper today. It illuminates how SCIENCE works versus how ANALYSIS works. I am NOT a “Climate Scientist”. In evaluating what’s happening in the field of Climate Science and in the “real world” that is actually an advantage.
Here/s what Hansen released on 11/10/23 and my take on it.
*note: most of the graphics in the paper are ones I have selected to help visualize what’s being discussed in Hansen’s paper.
How We Know that Global Warming is Accelerating and that the Goal of the Paris Agreement is Dead.
10 November 2023
James Hansen, Pushker Kharecha, Norman Loeb, Makiko Sato,
Leon Simons, George Tselioudis, and Karina von Schuckmann
ABSTRACT:
“The drive for global temperature change is Earth’s energy imbalance (EEI), the difference between the energy Earth receives from the Sun and energy Earth reflects and radiates back to space.”
“We have good measurement of EEI today based on precise satellite data for change of reflected and emitted radiation calibrated by decadal ocean heat content change measured by deep-diving Argo floats.”


“Interpretation of global temperature change and prediction of future temperature requires knowledge of the principal forcings that now affect Earths Energy Imbalance: human-made greenhouse gases (GHGs) and atmospheric aerosols (fine airborne particles).”

“Aerosol climate forcing is not being measured (we WILL come back to that), but information on aerosol forcing can be extracted from an ongoing “great inadvertent aerosol experiment” as a result of discrete changes in International Maritime Organization (IMO) regulations on the sulfur content of ship fuels.”
September 2021
Plunging sulfate aerosol emissions from industrial sources, particularly shipping, could lead global temperatures to surge well beyond the levels prescribed by the Paris Climate Agreement as soon as 2040 “unless appropriate countermeasures are taken,” Hansen wrote, together with Makiko Sato, in a monthly temperature analysis published in August 2021 by the Climate Science, Awareness and Solutions center at Columbia University’s Earth Institute.
What he is referring to is this.
Each year, more than 11 billion tons of stuff gets carried around the world by large ships. Clothes, flat-screen TVs, grain, cars, oil — transporting these goods from port to port is what makes the global economy go ‘round.
Since 2012, the EU has taken firm action to reduce the sulfur content of marine fuels through the Sulphur Directive. In 2016, the International Maritime Organization (IMO) maintained 2020 as entry-into-force date of a global 0.5% sulfur content in Marine Diesel Fuels cap.
Shippers brace for new rules to cut deadly sulfur emissions (2016)
The shipping industry is among the world’s largest emitters of sulfur behind the energy industry, with the sulfur dioxide (SOx) content in heavy fuel oil up to 3,500 times higher than the latest European diesel standards for vehicles.

“One large vessel in one day can emit more sulfur dioxide than all the new cars that come onto the world’s roads in a year.”

To combat such pollution, the International Maritime Organization’s (IMO) Marine Environment Protection Committee met in London on Oct. 24–28 (2016) and decided to impose a global cap on SOx emissions starting from 2020, which would see sulfur emissions fall from the current maximum of 3.5% of fuel content to 0.5%.
In January 2020 the European Commission followed through on that ruling.
Cleaner Air in 2020: 0.5% sulfur cap for ships enters into force worldwide
THAT was THREE YEAR'S AGO.
Back to Hansen’s paper today.
These limited assessment tools are threatened by the absence of firm plans to continue direct EEI observations.
“A shortcoming of our climate science is failure to communicate well what is known from existing data.”
“Global warming in the pipeline and emissions in the pipeline assure that the goal of the Paris Agreement — to keep global warming well below 2°C — is already dead, if policy is constrained only to emission reductions plus uncertain and unproven CO2 removal methods.”
— — — — — — — — —
THIS shouldn’t be a SURPRISE. The only people who are still arguing that “we must respect the SCIENCE” and “HAVE FAITH” in the current CLIMATE MODELS. Are the IPCC, the Fossil Fuel Companies, the MODERATES in Climate Science, the Techno-Optimists, and the “DOOMERS are WORSE than DENIERS” Hope-ium peddlers.
The people who insist that we “must not panic” and that “renewables are going to SAVE US”.
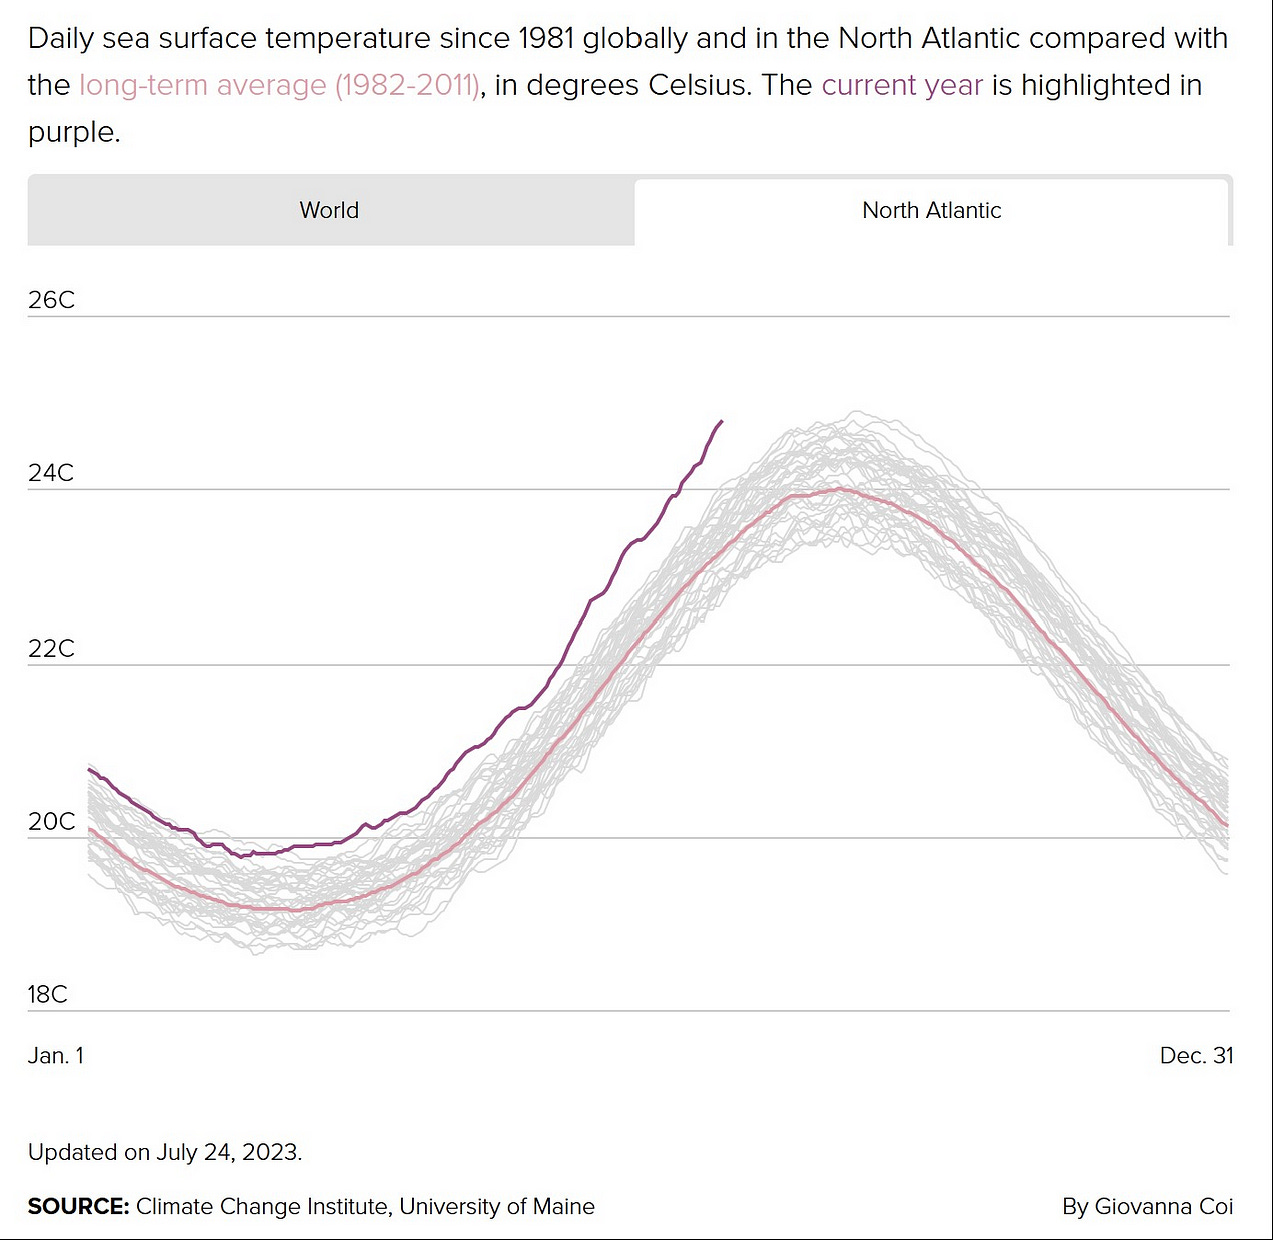
The people who don’t want to admit that we are “out of time”.
— — — — — — — -
“Delayed response of climate makes human-made climate change a grave threat, especially for young people.”
“Governments will not make required changes to energy policies based on theoretical threats — there must be sufficient empirical evidence of harm to force action.”
“Thus, delayed response makes it difficult to avoid near-term, growing, climate impacts, but it does not prevent achievement of policies that will lead to a hospitable climate with a bright future for young people. Time is running short, however, and effective actions at this point require a good understanding of ongoing climate change and the responsible mechanisms.”
Hansen is taking a lot of shit from the Doomer Community lately for statement’s like this. He is accused of being a “deluded old man” or a “sellout” for saying that it is still possible for there to be a “bright future for young people”.
Hansen’s “Doomer” critics accuse him of “sugar coating” the situation for holding out HOPE to people.
James Hansen is 82. He has hopes of winning a Nobel in Climate Science before he dies but that’s about as far as his ambitions go. He has had a FULL life and lived well.
James Hansen has children, grandchildren, and great-grandchildren. He FEARS for their future. He wrote a book about it, “Storms of My Grandchildren: The Truth About the Coming Climate Catastrophe and Our Last Chance to Save Humanity” (2010).
NO PARENT wants to accept that their children have NO HOPE for a FUTURE. Parents will hold onto HOPE and FIGHT until the very END. James Hansen is no exception.
“The proximate cause of ongoing global warming is Earth’s Energy Imbalance (EEI). Earth is now absorbing more energy incoming from the Sun than the planet is sending back to space as reflected solar light and emitted thermal (heat) radiation.”

“Factors that alter Earth’s energy balance are called climate forcings.”
“There are two large human-made climate forcings: changes of atmospheric greenhouse gases (GHGs) and changes of aerosols.
GHGs (CO2 and CH4 mostly) reduce heat radiation to space; thus, an increase of GHGs causes a positive energy imbalance, more energy coming in than going out, which causes warming.
Aerosols reflect sunlight to space (they ‘brighten’ the ALBEDO), which is a negative contribution to EEI that causes cooling.”
Greenhouse Gases.

“GHGs are accurately measured and their total climate forcing can be calculated with an error less than or about 10%.”
This is an interesting chart. Most of Global Warming is due to the effect of increased CO2 levels. You can see the MASSIVE drop in warming caused by the Mt. Pinatubo Eruption in 1991.

Changes in oil industry regulations caused a BIG drop in Methane levels in the late 80’s and early 90’s. Which is also reflected in this chart, the CH4 level markedly dropped through the 90’s and didn’t start climbing again until the mid-2000’s. Thank you, George Bush II and Republicans for that.
GHG forcing increase since 1750 is about 4.1 W/m2; as shown in Fig. 1 of our Pipeline paper,[1] our calculation agrees well with that of the most recent IPCC report.[2] We can even calculate the annual change of the GHG climate forcing to high precision.
In our graph of this annual change (Fig. 1), we show the five-year running mean because the large amount of “noise” in the annual mean tends to hide the trends that we wish to understand.[3] The 2022 point in the graph is a 1-year mean and the 2021 point is a 3-year mean, so these are provisional and will change as later data are added.
The integration (sum) of the annual GHG forcing increments (Fig. 1) yields the total GHG climate forcing, which is about 4.1 W/m2 for the interval 1750-present, as noted above.”
“This is a huge climate forcing, equivalent to that for doubled CO2 (2×CO2).”
The use of the phrase “doubled CO2” is significant. If you read my last two papers, you know that when Climate Scientists talk about “Climate Sensitivity”. What they mean is, “how much will the Earth WARM up if the atmospheric CO2 level increases from 280ppm to 560ppm?”
We have spent over a HUNDRED YEARS trying to answer that question.
What Hansen is saying, is that since 1750 the sum total of all the GHG’s or ‘CO2e” in the atmosphere “right now” is about equal to doubling the level of 1750 CO2 (260ppm) to a CO2 level of around 520ppm today.
Using 1750 as the “baseline” for the “preindustrial” CO2 level results in a “doubled” level of 520ppm instead of the more common 560ppm. Some Climatologists prefer 1750, some use 1820, the most common is 1850, and the Fossil Fuel Industry wanted it to be 1880.
Forbes; “Exactly How Much Has the Earth Warmed? And Does It Matter?” September 2018 By a University of Houston Energy Fellow.
“1850 was an arbitrary choice — The debate exists in part because the UNFCCC did not define preindustrial when setting the targets. What does “preindustrial” mean anyway? You can make an argument that it should be 1740, or 1820, or 1880. Each of these dates shifts the goalposts. We should pick a date all of us can agree on.”
“Global warming up to 2022 is only about 1.2°C, much less than the equilibrium warming for either the IPCC’s best estimate for 2×CO2 climate sensitivity (3°C) or our estimate in Pipeline (4.8°C ± 1.2°C).”
“There are two reasons why the present warming is small:”
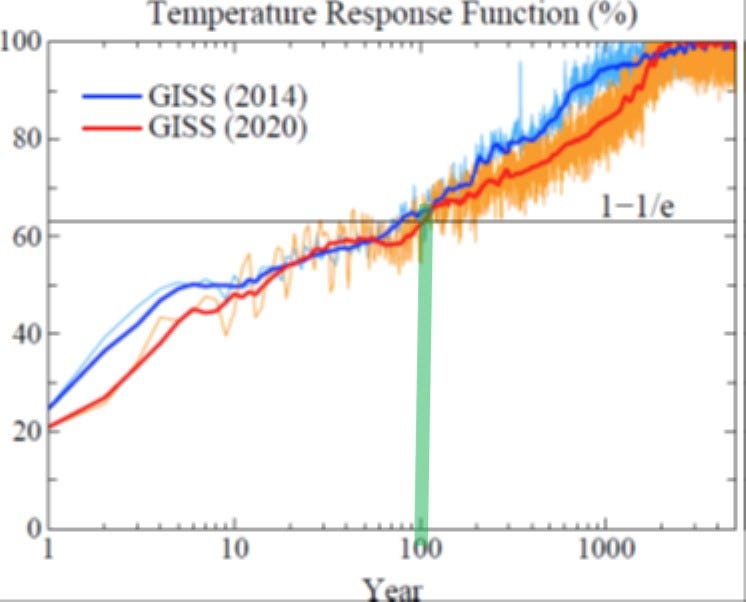
“First, present warming is only a fraction of the equilibrium warming, because of the ocean’s great thermal inertia. Even after 100 years the expected response to a forcing is only about 60 percent; most of the GHG forcing was added in just the past 50 years.”

“Second, the net human-made forcing is reduced by the (negative) human-made aerosol forcing of 1–2 W/m2 to a net of perhaps ~2.5 W/m2. The aerosol forcing is unmeasured, but we conclude in Pipeline that aerosol cooling has been underestimated by IPCC and updates of IPCC.”

“The ocean’s thermal inertia, in one sense, is beneficial in damping the climate response to human-made forcings, but it is a practical problem because it allows large potential future climate change to build up before the public notices much climate change.
In the paper Young People’s Burden, we argued that it was just conceivable to avoid irreversible consequences (e.g., large sea level rise) via rapid phasedown of fossil fuel emissions, improved forestry and agricultural practices, and reduction of methane (CH4) and other trace gases. That situation has changed because of the world’s continued failure to act.
Fig. 1 summarizes the situation, but below we will provide more damning evidence via measured EEI and, in the final section, via examination of IPCC assumptions.

“Fig. 1 includes a scenario for growth of GHG climate forcing, RCP2.6, which was defined in relation to the 2015 Paris Agreement goal to keep global warming “well below 2°C.”
“In RCP2.6, the GHG climate forcing growth rate is defined to provide a >66% chance that global warming will remain <2°C. However, an enormous gap has opened between the real world and RCP2.6.”
“Annual increase of the GHG forcing is now ~ 0.05 W/m2 per year (half a watt per decade), while RCP2.6 is (SUPPOSED TO BE) at 0.02 W/m2 per year today, decreasing to zero in less than 20 years.”
“This incredible scenario was supposed to be achieved largely via a vast array of biomass-burning powerplants that capture and sequester CO2, an implausible scheme that would be nature-ravaging and food-security-threatening. There are other issues with the Integrated Assessment Models (IAMs) that IPCC uses to define future GHG amounts and future climate, which we will address.”
“However, we first illustrate hard physical constraints that Earth’s energy imbalance provides for interpretation of the current climate situation.”
Earth’s Energy Imbalance (EEI).
“A decade ago, we estimated that EEI during the first decade of this century was +0.6 W/m2 averaged over the planet, which is about 16 times greater than humanity’s total energy use and equal to the energy of 400,000 Hiroshima atomic bombs per day.”
“About 90 percent of this excess energy is going into the ocean, where it slowly warms the ocean and melts ice. That was the magnitude of energy imbalance that was addressed in Young People’s Burden, when it still seemed conceivable that emissions could decline and realistic drawdown of atmospheric CO2 could help restore energy balance and stabilize climate.
However, since then, fossil fuel emissions have not declined; instead, they have grown, and Earth’s energy imbalance has approximately doubled (Fig. 3).”

“Cumulative ocean heat content presents only a limited indication of accelerating ocean heat uptake. Fig. 4, from Li et al., is representative of literature on ocean heat content change on decadal time scales. It shows an increasing rate of ocean heat uptake, but with large uncertainty bars because of sampling limitations, changing observing systems, and calibration issues.”
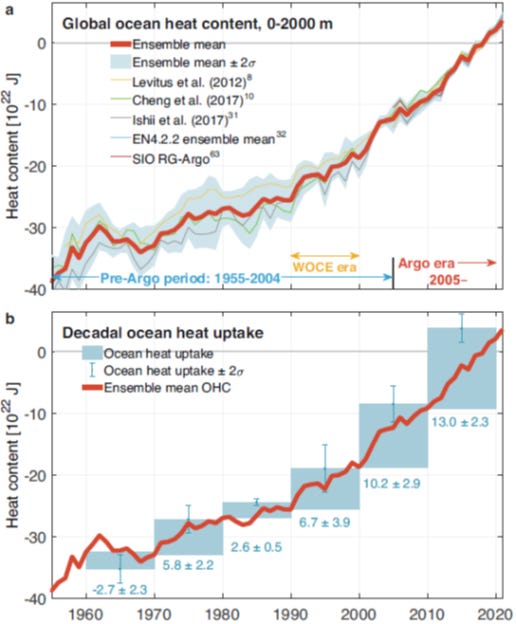
“Since 2006 there has been a good distribution of several thousand Argo floats that sample well the upper 2000 m of the world ocean, at least for latitudes 60N to 60S.”
“Even in this “golden” era of Argo data, ocean heat data must be averaged over at least a decade to approach the accuracy desired to interpret global climate change (0.1–0.2 W/m2 for Earth’s energy imbalance). Fortunately, the era of Argo data overlaps with satellite data for Earth’s emitted thermal and reflected solar radiation.”

“Decadal-mean ocean-heat-content-change calibrates satellite-observed radiation change, and the satellite data then provide finer spatial and temporal resolution of Earth’s energy balance. Crucially, the satellites measure emitted thermal radiation and reflected solar radiation individually. As we will show, this specific knowledge opens a window into understanding of the current climate situation.”

“Fig. 5 shows that an increase of absorbed solar energy caused the increase of EEI in the past decade, with the increase of absorbed solar energy beginning in about 2015.”
This information has implications for the mechanisms of accelerated global warming.
An increase of GHGs — either human-made or water vapor from the Hunga Tonga volcanic eruption in early 2022 — would operate by decreasing outgoing thermal radiation. Instead, there is a large increase of absorbed solar radiation (Fig. 5) and a moderate increase of outgoing thermal radiation (Fig. 6).
The known mechanisms that could produce a change of this nature are (1) change of solar irradiance, and/or (2) change of atmospheric aerosols/clouds.”

Change of solar irradiance is ruled out because solar irradiance was in its declining phase for a few years after 2015 (Fig. 7).
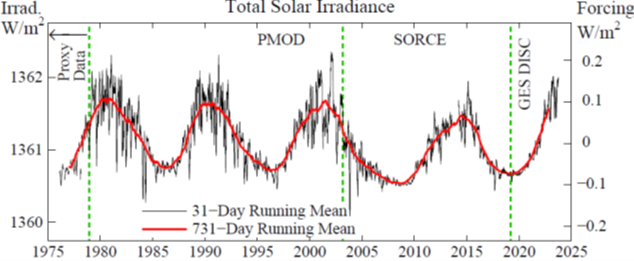
“Also, the amplitude of solar forcing from solar minimum to maximum is only ~0.2 W/m2, at least five times less than the observed increase of absorbed solar energy.”
“We conclude that the likely cause of the large change in Earth’s energy balance is a reduction in reflected solar radiation by aerosols and clouds.”
“Aerosols by themselves can be only a small fraction of the change, as the entire human-made aerosol forcing is only of the order of –0.5 W/m2,[2] so any global change would be no more than of the order of +0.1 W/m2.
On the other hand, rather small changes of clouds can have a large impact on EEI.
We conclude in Pipeline that cloud changes are the feedback that increases what would otherwise be a planetary sensitivity of 2.4°C for 2×CO2 to the empirically-derived real-world sensitivity of 4.8°C for 2×CO2. Similarly, it does not take much cloud change to produce the ~1 W/m2 increase of absorbed solar radiation (Fig. 5).
How can we evaluate whether decreased (less negative) aerosol-cloud forcing is the cause of the global increase of absorbed solar radiation?
A great opportunity, as described in Pipeline, is the inadvertent experiment caused by restrictions on the sulfur content of ship fuels, which were imposed in 2015 and strengthened in 2020.
Satellite data for Earth’s radiation budget show that absorption of solar radiation increased about +3 W/m2 in the regions of heavy ship traffic in the North Pacific and North Atlantic Oceans after imposition of the restrictions. This regional +3 W/m2 forcing is greater than obtained in some aerosol-cloud modeling, but the modeling is difficult and uncertainties are large.
Analyses of aerosol physics based on this marvelous, inadvertent, aerosol experiment, surely, are only just beginning.”
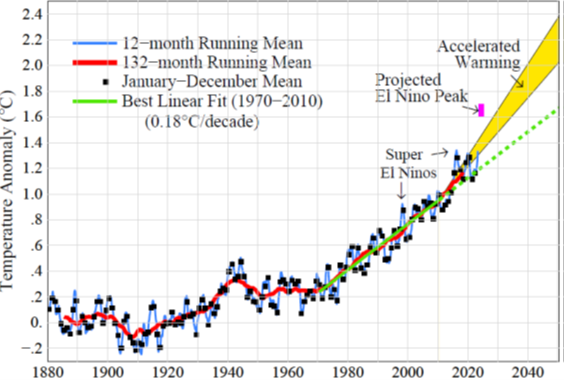
Fig. 8. Global temperature relative to 1880–1920 based on the GISS analysis.[22],[23]
Is increased absorption of solar radiation (Fig. 5) a BFD?

It was asserted by one of us during the webinar on the Pipeline paper that observed increase of solar radiation absorbed by Earth is a BFD (a big deal).
“That assertion is based on our interpretation that the increased absorption of solar energy by Earth results from reduced aerosol pollution, i.e., it is the first payment in our Faustian bargain in which we offset much of GHG warming via aerosol cooling.”
“Implications of an increase of absorbed incoming energy of the magnitude in Fig. 5 are staggering. The increased absorption of solar energy is a climate forcing, equivalent to the forcing from increasing GHGs.”
“Increased climate forcing of 1 W/m2, given current global CO2 amount of about 420 ppm, is equivalent to increasing atmospheric CO2 to about 500 ppm.
The observed increase of solar energy by 1.34 W/m2 since 2020 (Fig. 5) is equivalent to increasing CO2 to about 525 ppm.
Here is another illuminating impact of this increased absorption of solar radiation.
As a conservative estimate let’s take 1 W/m2 as the increase of absorbed solar radiation. Also, as a round, conservative, estimate, let’s take equilibrium climate sensitivity (ECS) as 4°C for 2×CO2.
How much added warming will this cause, over and above the 0.18°C per decade warming from GHGs?
Fig. 2 tells us the answer.”
“Within less than a decade, we must expect 0.4×0.25×4°C = 0.4°C additional warming. Given global warming of 0.95C in 2010, the warming by 2030 will be about 0.95°C + 2×0.18°C + 0.4°C = 1.71°C.”
“Global warming of 2°C will be reached by the late 2030s, i.e., within about 15 years.”
“The added climate forcing — presumed to be our first Faustian payment — is, indeed, a BFD.”
“Note that absorbed solar radiation (Fig. 5) shows no indication of an increase in the period 2005–2015 when sulfur emissions in China are thought to have decreased rapidly. The likely explanation is that the air there was still polluted with aerosols even after sulfate reductions; also, remaining sulfates were not negligible. Aerosols in pristine marine environments are expected to have a much larger effect on clouds.”
High priority observations.
“The scientific method dictates that we monitor GHG and aerosol climate forcings. However, given that we are not monitoring the aerosol forcing, it is essential to continue satellite radiation budget and Argo float measurements. Radiation budget observations have been a priority of NASA for the past two decades, but the workhorse satellites are nearing the end of their lifetimes.”
“It is important that the measurements continue with comparable data quality.”
“This will surely require investment in small satellite technology. Despite many competing proposals for research, development, and space deployment, this topic surely deserves high priority. The Argo measurements need to be expanded, especially into the polar regions where some of the most important climate change is occurring.
Given that access to space is becoming easier, we might ask whether the private sector could support the measurements. That is a steep ask, but during the Trump Administration — when it appeared that support for climate research in the U.S. government may be severely curtailed — philanthropists picked up some of the slack.
We made a proposal (Aerosols, the Ocean and Ice: Impacts on Future Climate and Sea Level) including Chinese colleagues with the emphasis on satellite aerosol observations and analysis of Eemian climate change, when sea level rose several meters in less than a century while global temperature was little warmer than today.
The major cost, for satellite observations, would have been covered entirely by the Chinese government. Although Schmidt Futures did not provide a debriefing when the proposal was not selected, our impression was that they had a preference for GCM studies, similar to the IPCC emphasis on GCMs as opposed to a more equal balance of paleoclimate, GCMs and analysis of ongoing Earth observations.
Independent of proposals, it seems to us that scientists in the West should make a special effort to continue collaborations with colleagues in the East, as successful actions to address climate change will surely depend upon much improved East-West cooperation.”
Climate sensitivity.
“Out of time, so will need to address this in a later communication, but we can point out a couple of nuggets of information. One is Fig. 9, which was shown by George Tselioudis in our webinar, based on figures in published papers of Zelinka et al.[29] and Jiang et al.”
Fig. 9. See text.
“Fig. 9 compares low cloud feedbacks in CMIP5 and CMIP6 GCMs, those being the models used in support of the last two major IPCC reports.
Higher sensitivity in the later models is mainly a result of stronger, amplifying, cloud feedbacks. The question is: which models are more realistic?
A hint is provided by the colored diagrams on the right.
The first of those shows cloud cover generated by the average of the models with high climate sensitivity (average ECS about 5°C for 2×CO2), the second shows the same for low ECS models, and the third is observations.
High ECS models look a lot more like observations; it is not just a matter of a numerical value. The low ECS models have the seasonal variation of cloud cover entirely wrong at high latitudes, where the cloud feedbacks are large, while the high ECS models capture the correct seasonality.
This doesn’t prove that the high ECS models are “correct,” but it is a strong point in their favor.
Jim Zachos, despite his modesty, is probably the world’s leading authority on long-term climate change and especially on knowledge obtained from ocean sediment cores, so we were glad to receive the recent note from him:
“FYI…there are some new studies using independent proxies to quantify deepsea T (Temperature) over the Cenozoic, for example, based on clumped isotopes (or Mg/Ca), all suggesting warmer T than previous reconstructions based solely on benthic d18O. The discrepancies involve multiple factors most notably a pH effect. This is not surprising…something I’ve always suspected.”
More evidence is accumulating that our Climate Sensitivity models are off. A discussion of:
Cenozoic evolution of deep ocean temperature from clumped isotope thermometry : Science/30 Jun 2022/Vol 377, Issue 6601 pp. 86–90/DOI: 10.1126/science.abk0604
“In this paper recently published in Science, Professor Nele Meckler of the University of Bergen and colleagues argue that the climate between around 35 and 60 million years ago may have been considerably warmer than we thought.
Their finding suggests that a given level of CO2 might produce more warming than prior work indicated, and it hints that the ocean circulated differently during that warm, ice-free climate.”
I encourage you to read the paper’s abstract and then the article. It does a better job than usual in explaining what the paper means and the science of it. The thing I want to focus on is this:
The new method indicates that between 57 and 52 million years ago, the North Atlantic abyss samples show the global temperature was about 20°C warmer than our 1850 baseline. That’s a big difference from the oxygen isotope data, which yielded temperatures of 12–14°C. “That’s a whole lot warmer,” said Meckler.
“Nevertheless, these studies conclude that the 1:1 scaling of deepsea d18O with GMST (Global Mean Surface Temperature) is still valid in part because of an increasing seasonal bias in deep water formation as GMST increases, which balances polar amplification. The bottom line is that these higher T (Temperature) estimates will yield a higher ECS for the early Eocene, in the range of 5°C.
The Cenozoic climate analysis is probably the best part of the Pipeline paper, but the discussions of the paper have largely ignored it. We will summarize that part of the paper in a later communication.
Further discussion of the difficulties with the Integrated Assessment Models (IAMs) that IPCC relies on will also have to wait for a later communication.”
— — — — — — — —
Here’s how I finished my “Climate Report 2022” last February. Almost two year/s ago.
“What Hansen is saying is that albedo has two components: clouds and haze. What the Earthshine and CERES projects are measuring is a decline in the Earth’s albedo.
This could be caused by “cloud diminishment” as suggested by Goode. Or it could be caused by a reduction in haze caused by a reduction in sulfur dioxide due to the changes in diesel fuels used by the global shipping industry, which is what Hansen is arguing.
This is an important question. There are serious implications from each of these scenarios. If it’s a combination of both factors the ratio between them will be crucial. We will settle this issue over the next decade. What’s important for now is to be really clear about one thing.”
Global warming has accelerated since 2014, almost doubling the rate of warming.
It’s nice that Hansen agrees with me now. The SCIENCE has “caught up” to what ANALYSIS of the “fact pattern” was showing several years ago.
That’s the difference between a “Scientist”, like Hansen, and an “Analyst” like me. Scientists have to wait until are “certain” the evidence is unequivocal. Analysts look at the evidence and tell you what they think it means “right now”.
Good analysts, are the ones that are USUALLY right.
Things are getting worse much more quickly now. Because now we live in “Bomb Time”.
Bomb Time — The hyper accelerated rate of warming and climate change that will compress 1,000 years of normal inter-glacial warming into the next 20 years of human time as the thermal pulse from our “climate bomb” hits the planet.
This is my analysis.
This is what I see.
This is my “Crisis Report”.
-rc 111123






Took my first pause to digest moment at this part: “Power plants produce MORE SOx particulate than ships do BUT, their effect is SMALLER because they are FIXED points. While ships blanket the planet in SOx.”
Sigh…