


The Crisis Report - 107
I am becoming more and more confident that we are looking at +3°C of warming BY 2050.

This paper comes right out and says it.
The history of a + 3 °C future: Global and regional drivers of greenhouse gas emissions (1820–2050) — Global Environmental Change, Volume 92, July 2025, 103009
Let's consider this carefully. Reaching +3°C of warming by 2050 probably means civilizational COLLAPSE by 2050. At least the insurance industry thinks so.
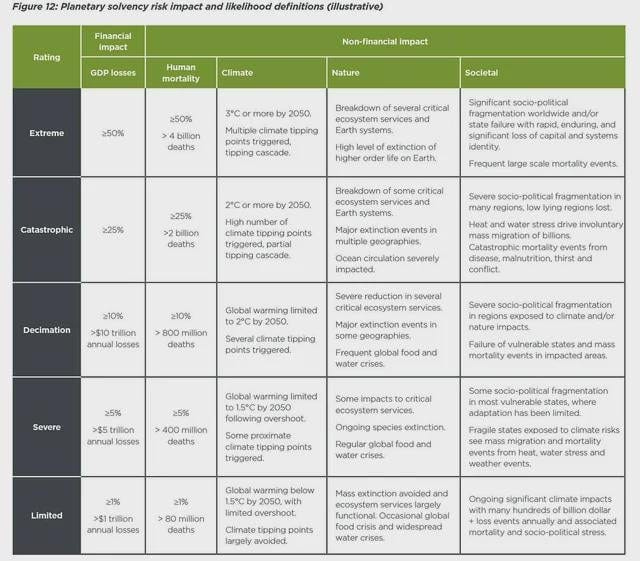
Their estimates are:
Global Warming limited to +2°C by 2050 = approximately -10% decline in global population (800 million deaths).
Global Warming of +2°C or more by 2050 = approximately -20% decline in global population (2 billion deaths).
Global Warming of +3°C or more by 2050 = approximately -50% decline in global population (4 billion deaths).
At +3°C of warming they forecast:
“Multiple climate tipping points triggered, tipping cascade. Breakdown of several critical ecosystem services and Earth systems.” “High level of extinction of higher order life on Earth.” “Significant socio-political fragmentation worldwide and/or state failure with rapid, enduring, and significant loss of capital and systems identity.” “Frequent large scale mortality events.”
IF, we are looking at COLLAPSE by 2050 then we can expect the “tempo” of collapse related\inducing events to significantly increase over the next five years. Collapse by 2050 means.
We are no longer at the “End of the Beginning”. We are at the “Beginning of the End.”
With that in mind, let's look at what this paper has to say. It starts with this.
ABSTRACT
Identifying the socioeconomic drivers behind greenhouse gas emissions is crucial to design mitigation policies. Existing studies predominantly analyze short-term CO2 emissions from fossil fuels, neglecting long-term trends and other GHGs.
We examine the drivers of all greenhouse gas emissions between 1820–2050 globally and regionally.
The Industrial Revolution triggered sustained emission growth worldwide — initially through fossil fuel use in industrialized economies but also as a result of agricultural expansion and deforestation.
Globally, technological innovation and energy mix changes prevented 31 (17–42) Gt CO2e emissions over two centuries. Yet these gains were dwarfed by 81 (64–97) Gt CO2e resulting from economic expansion, with regional drivers diverging sharply: population growth dominated in Latin America and Sub-Saharan Africa, while rising affluence was the main driver of emissions elsewhere.
Meeting climate targets now requires the carbon intensity of GDP to decline 3 times faster than the global best 30-year historical rate (–2.25 % per year), which has not improved over the past five decades.
Failing such an unprecedented technological change or a substantial contraction of the global economy, by 2050 global mean surface temperatures will rise to more than +3°C above pre-industrial levels.
INTRODUCTION
Effectively implementing the Paris Agreement while sustaining present rates of economic growth is only possible with radical and urgent actions to drastically reduce the carbon intensity of the global economy, i.e. the greenhouse gas emissions (GHGe) per unit of economic output.
IE. — If we want to get to “net zero” without degrowth. Then the ratio of (GHG+GHGe Emissions per unit of Global GDP) has to RAPIDLY FALL.
This fall in carbon intensity can result from two main mechanisms.
The first is the reduction of the energy intensity of GDP (i.e. the energy spent per unit of value added) via technological improvements, structural change in favor of less-polluting sectors of the economy, and changes in consumption patterns.
IE. — Produce more using less energy, stop using fossil fuels “in favor of less-polluting sectors of the economy”, and stop making so much useless shit.
The second is the reduction of the emission intensity of energy use (i.e. the carbon released per unit of energy consumed) through energy transition towards cleaner energy sources and the development of carbon removal strategies.
IE. — RAPIDLY switch to renewables and nuclear while pursuing ways of “carbon drawdown” from the atmosphere.
Now remember, this paper is a “history” of how we got where we are today AND then analyzes that history to forecast a “most likely” future. The authors spend a lot of time discussing how their analysis is different from previous works, new information they have developed, and their methodology. Here's a sample:
Most of the literature on the socio-economic drivers of emissions presents two main limitations. First, studies are usually based on very limited historical evidence, covering short periods, usually from 1990 to the present. This lack of a deeper historical perspective is primarily due to data availability, as consumption-based accounting — that is, considering the carbon footprint of countries — is only available, at best, since 1990.
Nevertheless, there is another underlying reason why scholars work with data only since 1990: it was during the 1990s that the international community began to take institutional action on climate change. That is, it is implicitly assumed that significant improvements in the relationship between emissions and economic growth occurred only when active measures were taken.
The second limitation is that, with a few exceptions (Lamb et al., 2021, Liu et al., 2019, Sanchez and Stern, 2016), this literature tends to consider only CO2 emissions from fossil fuels.
Recent studies have shown that fossil fuels’ CO2 accounts for 68 % of global emissions today and for only 49 % of cumulative emissions since 1820 (Friedlingstein et al., 2022, Gütschow et al., 2021).
The remaining emissions were generated by other activities, such as CO2 released by land-use change, or are due to other gases, mainly CH4 and N2O. Not counting these emissions misrepresents the history of climate change, as it ignores the part played by economic activities which decisively contributed to rising temperatures.
These limitations prevent us from properly understanding the drivers of GHGe, and more crucially they often lead to an inaccurate narrative of climate change history.
Most historical narratives tend to associate climate change with the emergence of industrialization and the growing use of fossil fuels in manufacturing, overlooking other types of emissions and activities that have significantly contributed to changes in the climate.
The unprecedented increase in global emissions that took place in the 19th century was undoubtedly linked to the spread of the industrial revolution, but this owed as much to the expansion of the global agricultural frontier as it did to fossil fuels in factories.
OBJECTIVE
In this paper, we study the long-term global evolution of GHGe (CO2, CH4, N2O, and fluorinated gases) and their drivers. This approach allows us to substantially expand, across both time and space, the existing evidence on socio-economic drivers of emissions, providing a bird’s-eye view of the modern origins of anthropogenic climate change, and finally using history as a yardstick to assess the changes required by current climate agreements.
They ask.
How have the different types of GHG emissions evolved over time and space?
What have been the main drivers behind the historical growth of GHGe?
How have these drivers changed across regions and periods?
Is there (ANY) historical evidence of technological and productive changes that reduced carbon intensity at the pace needed for the next few decades?
Or are we instead facing an unprecedented challenge in human history?
METHODOLOGY
To address these issues, we trace GHGe and their socioeconomic drivers between 1820 and the present. Drawing upon different sources we construct a country-level database with annual series of emissions, energy use, GDP, and population (full details in Methods).
The emissions series includes all GHGe (CO2, CH4, N2O, and fluorinated gases), harmonizing different datasets which provide annual data at the national level (Friedlingstein et al., 2022, Gütschow et al., 2021, Hurtt et al., 2011, Jones et al., 2023).
Energy consumption series are taken from Malanima (2022), which are the only ones to incorporate traditional energy carriers (including food and fodder for human and animal muscle energy) at the regional scale.
GDP and population data are taken directly from the Maddison Project Database (Bolt and van Zanden, 2020) which offers global coverage since 1820 at the regional level (national-level estimates usually have a much shorter coverage). Thus, for our regional analyses we follow the 8 country groups defined by the Maddison Project. To systematically examine the drivers of variations in emissions we rely on the Kaya Identity to produce a decomposition analysis using the Logarithmic Mean Divisia Index method (Ang, 2005).
We distinguish five periods based on economic and environmental historiography.
First, the initial spread of industrialization and globalization between 1820 and 1913 (Allen, 2017, O’Rourke and Williamson, 2001).
Second, the World Wars and interwar period between 1914 and 1945, characterized by a global economic downturn, especially in Western countries.
Thirdly, the decades of the ‘Great Acceleration’ (Steffen et al., 2015) of environmental impacts and economic growth between 1945 and the 1980 s, including the ‘late industrialization’ in much of the global periphery (O’Rourke and Williamson, 2017).
Fourthly, we consider the period between 1990 and the present, characterized by a new expansion of international trade, the fast growth of large Asian economies (Baldwin, 2017), and the relative decline in emissions in some parts of the West (Le Quere et al., 2019).
Finally, we analyze 2050 scenarios considering the requirements of the Paris Agreement and different projections of economic growth.
SCENARIOS
We analyze whether the historical trends of carbon intensity of GDP (i.e., greenhouse gas emissions per unit of GDP) are compatible with current climate agreements and future economic projections.
To do so, we compare the historical evolution of carbon intensity with different future scenarios combining projections of economic growth and emissions.
For economic growth, we rely on the OECD’s long-term projections, which estimate that global GDP will nearly double by 2050 (OECD, 2023).
For emissions, we use as benchmarks the C3 and C4 pathways assessed in the IPCC’s Sixth Assessment Report (AR6) (IPCC, 2022), which correspond to global warming levels of approximately 2 °C and 3 °C by 2100 (>67 % likelihood), respectively.
According to the IPCC, these scenarios project global greenhouse gas emissions (GHGe) in 2050 of approximately 20 GtCO2-eq for C3 and 35 GtCO2-eq for C4. Following the approach replicated in previous studies (e.g., Jackson et al., 2024), we estimate the current global carbon intensity and the level required in 2050 under each scenario.
With this information, we calculate the implied annual reduction rate in carbon intensity (also referred to as the decoupling rate) that would be needed to meet the 2 °C and 3 °C scenarios, and we compare those rates with historical trends.
With this exercise, we simply aim to reflect the scale of the future change required in the context of regional and global historical experiences.
CAVEATS
These benchmarks could be even more demanding for two reasons.
First, recent research has calculated that the remaining carbon budget is smaller than the one reported by the AR6 of the IPCC (Lamboll et al., 2023).
Second, some studies question the potential of new technologies for carbon sequestration, e.g., so-called biomass carbon capture and storage (BCSS) (Anderson and Peters, 2016, Fuss et al., 2018, Smith et al., 2016). As a result, some scholars argue that the impact of these technologies will be smaller than the one predicted by the models considered in the IPCC reports (Grubler et al., 2018a, Vogel and Hickel, 2023). If sequestration is indeed more limited, the decoupling rate would also need to be higher.
IE. — If the carbon capture and sequestration technologies don't VASTLY improve, VERY QUICKLY, we are in deep shit.
Now what follows is an “in-depth” analysis of “Historical trends in global GHG emissions”. Which I found REALLY interesting. It breaks down GHG emissions from 1820 to the present day in a number of novel ways. By looking at GHG emissions from land use and land-use change (LULUC) a more nuanced view of “how we wound up with the CO2 level at 430ppm” comes into focus for the first time.
If you want all of the details you will need to read the paper. here are some things that stood out to me.
200 years of CO2 emissions.
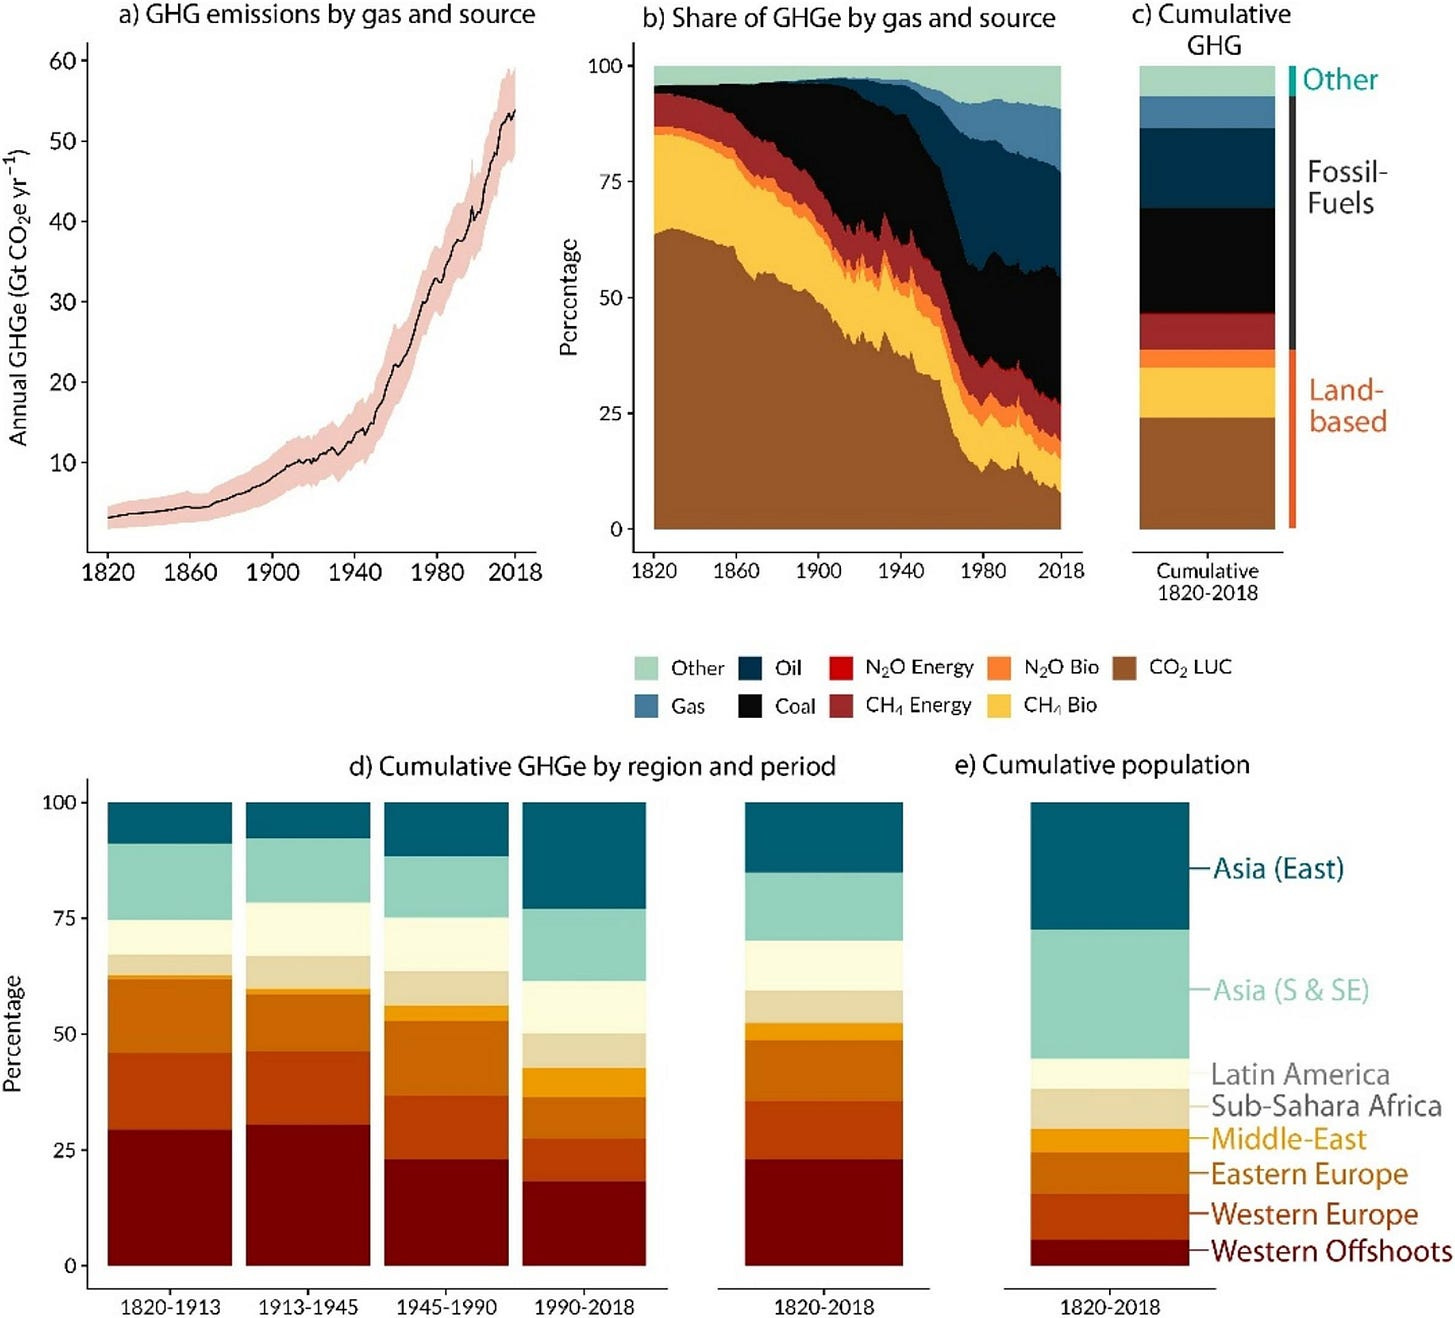
Since the early 19th century, annual anthropogenic GHGe have risen to ever-larger levels, from 3.1 (±1.4) Gt CO2e in 1820 to 53.9 (±5.4) Gt CO2e in 2018 (Fig. 1a).
While this increase in GHG’s is often attributed primarily to CO2 emissions resulting from the large-scale use of fossil fuels since the Industrial Revolution, these were not the main source of GHGe until 1969 and only represent 48% of cumulative emissions since 1820.
Even when considering the ‘fugitive emissions’ (N2O and CH4) from fossil fuels, their total cumulative contribution to overall emissions is still only 56% (Fig. 1c).
The other 44% of emissions are essentially due to the so-called Agriculture, Forestry, and Other Land Uses (AFOLU) emissions (hereafter referred to as land-based emissions) and, in much smaller measure, to other activities (e.g. cement production) and gases (e.g. fluorinated gases).
Among land-based emissions, the most important is the CO2 released as a result of land use and land-use change (LULUC) −mainly through deforestation-, representing 23% of global cumulative emissions and remaining the single largest source until as late as 1965.
Deforestation accounts for 23% of the cumulative CO2 generated since 1820.
Biogenic emissions of CH4 and N2O, generated primarily by agricultural activity, and to a lesser extent by waste management, accounted for 18% of cumulative emissions.
The methane (CH4) and nitrous oxide generated by farming and “cows” accounts for around 18% of cumulative emissions since 1820.
The global geography of historical emissions has been extremely uneven (Fig. 1d–e). Western countries, accounting for only 15% of world population, have produced 36% of cumulative GHGe (and 47 % of fossil-fuel emissions).
This is a more nuanced “take” on the question of “who’s responsible for this mess. It doesn't change the basic narrative that the WHITE 15% of the world’s population have disproportionately benefited from the use of fossil fuels while recklessly polluting the atmosphere. BUT, it does significantly reduce their “share” of the guilt.
The Western countries, 15% of the world population, are responsible for about 36% of cumulative GHGe since 1820. HOWEVER, they are responsible for 47% of fossil fuel emissions since 1820.
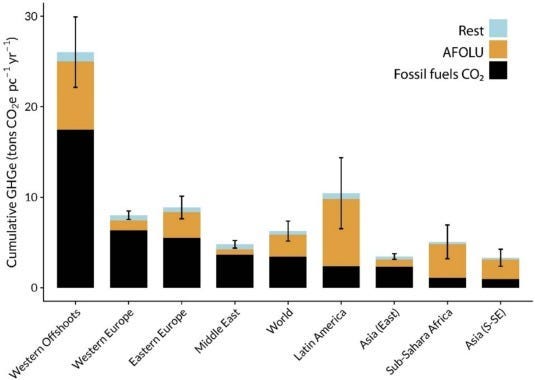
In terms of which regions bear the most “cumulative guilt” for the last 200 years the “Western Offshoots” (US, Canada, Australia, and New Zealand) are far and away the most guilty. The “surprise” is how much the deforestation of Central and South America influences the per capita historic CO2 “debt” accumulated in this region.
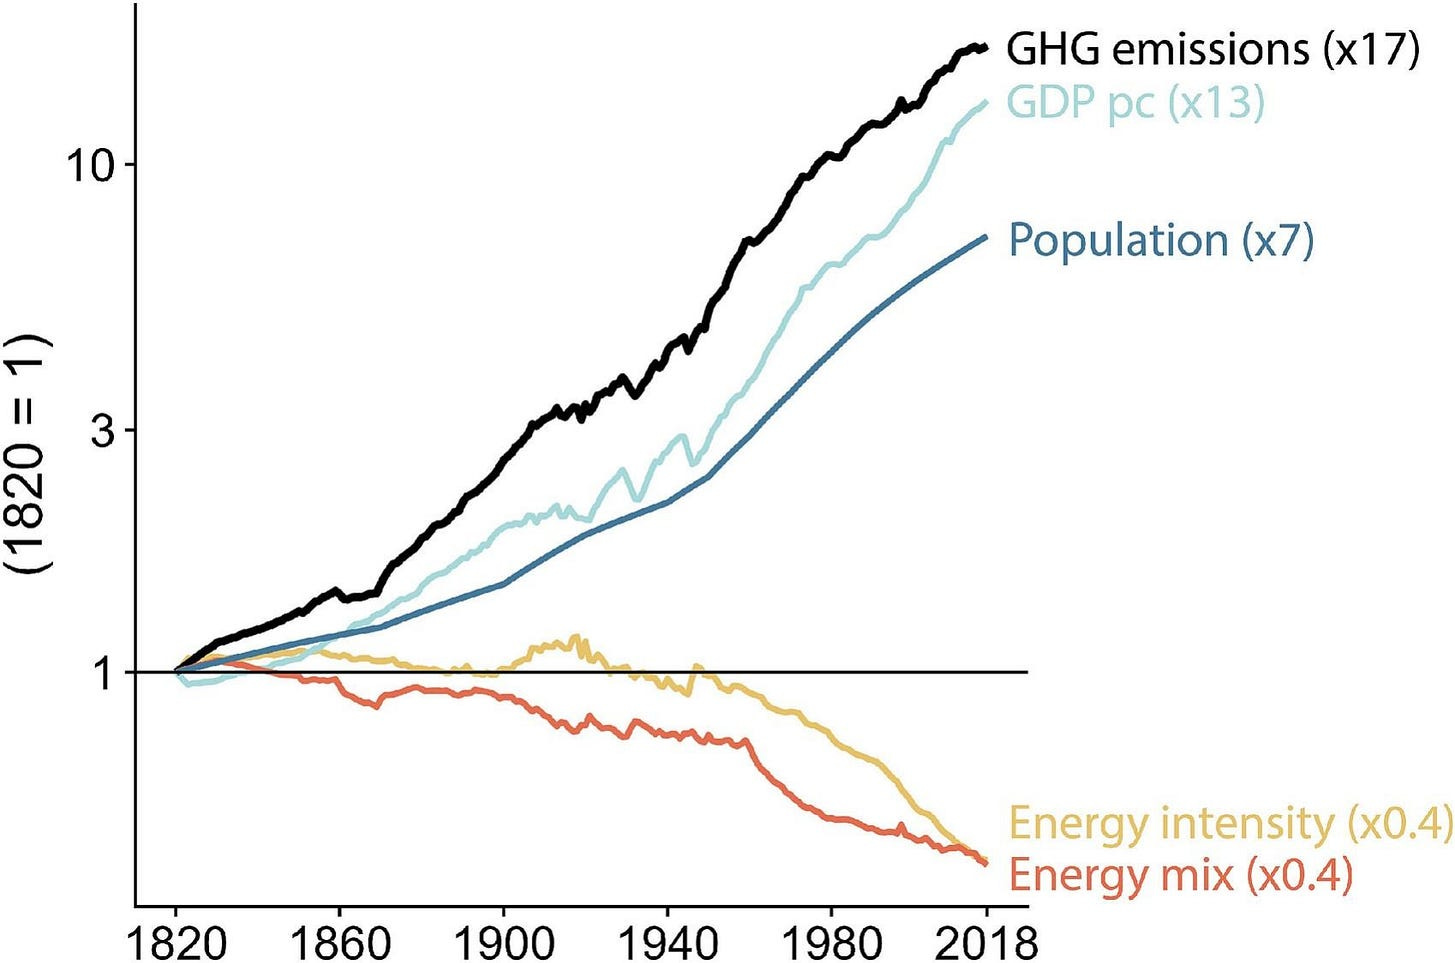
Since 1820 the world’s population has increased sevenfold (x7).
Global per capita income has increased thirteenfold (x13)
Global emissions have increased to 51Gt CO2e Per year. A seventeenfold (x17) increase since 1820.
Putting that into context for the last 800,000 years.

Section 3.4 The history of a +3°C degree future
Or, WHY they think this means we are likely to hit +3°C of warming by 2050.
According to the OCDE, global GDP will multiply by 1.9 (assuming an average annual growth rate of 2.6%) by 2050.
Meanwhile, to fulfill even the least ambitious aim of the Paris Agreement — KEEPING global mean surface temperature (GMST) below a +2°C rise above pre-industrial levels — , total emissions would have to decrease by ∼65% between 2019 and 2050 (an annual growth rate of −3.4%).
Achieving both goals at the same time (economic growth and emission reductions) would require an amazingly rapid fall of the carbon intensity of the global economy (emissions per unit of GDP).
Following these projections, carbon intensity would have to fall from the current 0.5kg CO2e down to only 0.009kg CO2e per dollar of GDP by 2050, a cumulative yearly reduction of −5.7%. Are there historical precedents for such a reduction?
How ambitious/realistic is that goal in the light of the preceding history of emission-mitigating technological change?
NO 10-year period during the past two centuries has shown a fall in carbon intensity remotely compatible with both economic growth projections and the Paris Agreement climate targets.
Even if the world were to replicate the best-performing regional trajectories in history for three consecutive decades, this would still fall short of the +2°C pathway. Merely matching the best global historical performance would place us on a trajectory above +3°C.
Additionally, we also observe that the downward trend in carbon intensity has stabilized in recent decades. That is, while it continues to decline, the rate of decline has leveled off, and there are no signs that we are approaching the expected levels.
WHICH BRINGS US BACK TO HERE.

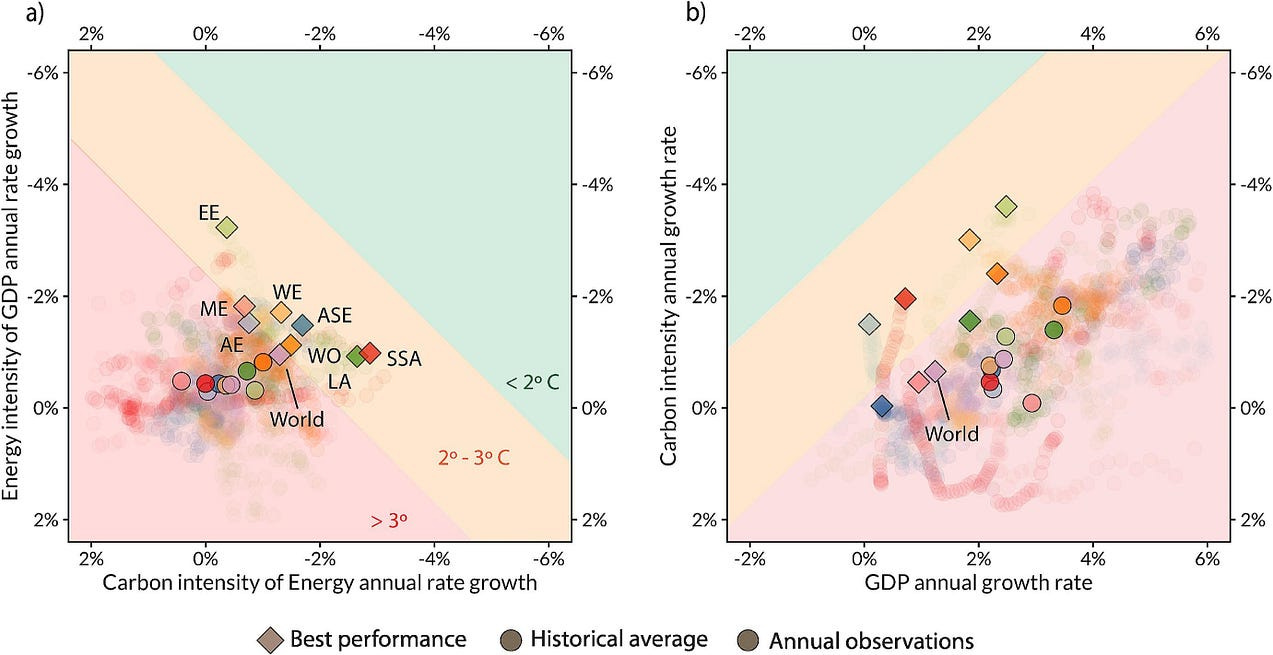
a) Annual growth of the energy intensity of GDP (y-axis) and annual growth of the emission intensity of energy (x-axis), 30-year moving averages. ‘Best performance’ refers to the year with the largest fall in the carbon intensity of GDP (as the combined effect of the variables in both axis).
b) Annual growth of GDP (x-axis) and carbon intensity of the economy (y-axis). ‘Best performance’ refers to the year with the largest fall in GHGe (as the combined effect of the variables in both axis).
In panels a) and b) colors in the background represent temperature outcomes by 2050 depending on the evolution of the variables considered.
The red area implies global mean temperatures more than +3°C above pre-industrial levels; the orange area refers to temperatures between +2°C and +3°C above pre-industrial levels; the green area represents outcomes below +2°C. Light circles represent yearly observations; dark circles represent the historical mean; diamonds represent the largest reduction in history for each region.
WHICH SHOWS
Even if from now on the world replicated the best historical performances by any region, the emissions trajectory would still lead to warming levels well above the international targets.
An especially revealing case is that of Eastern Europe (GREEN DIAMOND). During its best-performing period (1985–2014), the region achieved a level of economic growth of +2.5% −comparable to current global growth projections for 2050-, combined with the largest recorded regional decline in carbon intensity (-3.6%). Yet even replicating this exceptional performance would still result in +2°C of warming.
Sustaining economic growth at the pace projected by the OECD would require unprecedented efficiency improvements in the carbon intensity of the global economy. Conversely, if carbon intensity were to continue declining at its current historical average, meeting climate goals would only be possible through a sustained global GDP contraction of around –1.4% per year. Such a prolonged recession, however, has no regional or global precedent in modern global history.
CONCLUSIONS
Historical analysis is, by definition, the opposite of prediction, so historians are rightfully wary of speaking of the future (reconstructing past evidence is already hard enough). Indeed, no amount of historical data can prove whether the Paris Agreement’s climate targets for 2050 are achievable.
What historical analysis can do, however, is give us a higher vantage point from which to discern the contours and the magnitude of present challenges. Our reading of the long-term evidence, in line with the recent analysis by Smil (2024), is that our history does not look like the past of a +2° future.
The history of anthropogenic emissions over the last two centuries shows that, despite significant regional disparities, modern societies have managed to limit emissions through improved technology and a gradual shift to cleaner energy. Yet, these improvements have not been enough to offset the growth in economic activity.
The present pace of carbon intensity reduction is insufficient to meet climate targets under current economic growth projections.
This does not prove that these targets are unattainable.
Historical analyses does not predict the future, but it provides the tools, knowledge, and context needed to confront it. In other words, a historical perspective does not question the possibility of a black swan; instead it tells us precisely how large black swans have been in the past, so that we can get a sense of the scale of the one needed now.
Historical trajectories reveal that, when looking back, the changes required to sustain economic growth within safe climate limits demands transformations on an entirely unprecedented scale — transformations far greater than those seen in recent years.
The BIG “climate news” last week was that the yearly increase in atmospheric CO2 in 2024 was +3.6ppm. That's +36ppm per decade, or +100ppm in just 27 years. Resulting in a CO2 level of +530ppm around 2050.

May 2025 experienced the first 430 ppm+ monthly CO2 average in human history. — Bill McKibben
The last time that atmospheric CO2 concentrations topped 430 ppm was most likely more than 30 million years ago. — Ralph Keeling, Director Scripps CO2 Program.
I am becoming more and more confident that we are looking at +3°C of warming BY 2050.
This is my analysis.
This is what I see.
This is my “Crisis Report”.
rc 06/16/2025
Addendum:
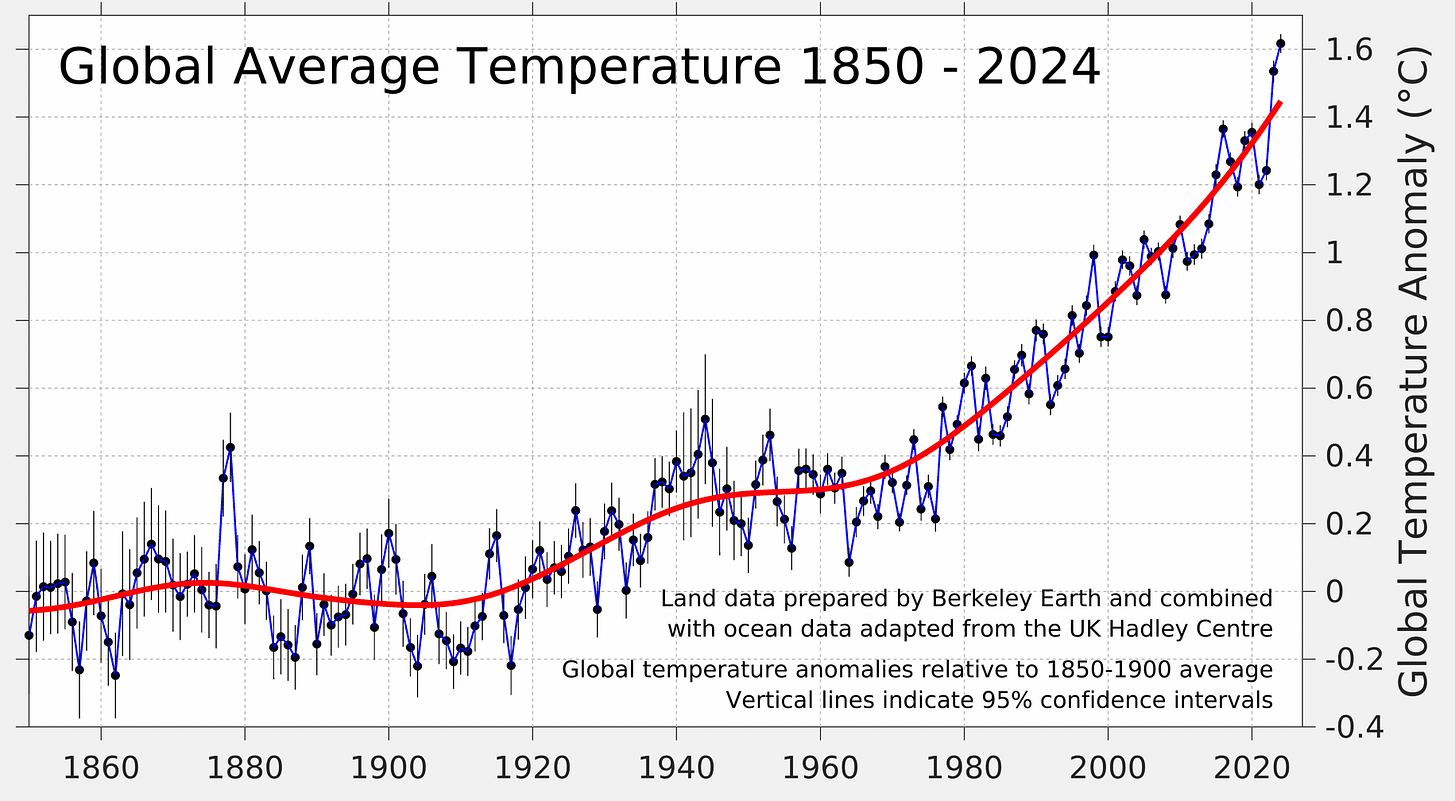
We hit +1°C (sustained) around 2011. It took about 160 years for that to happen.
We will be at +2°C (sustained) by 2035 (at the latest). That’s about 25 years.
If that Rate of Warming continues then we WILL hit +3°C (sustained) around 2050.
I think we all need to start thinking in those terms.
This is happening SO FAST that almost everyone alive is going to go through this.
These last few years have been the “End of the Beginning” the next few years will be the “Beginning of the End”.
Things are going to start getting a LOT WORSE, very quickly over the next decade.
Thank you, Richard, for doing the hard work required to keep your subscribers informed on this critical subject. None of it makes me happy, but at least I have a better sense of what perilous times we have entered into. I feel truly sad for the children who will live in such challenging times for all life on earth. Parents of the lovely children can’t really express to their offspring how bad things will be for them because it would be dampening hope and joy. We are locked into hope for abundance while also trying to fight rising greenhouse gases. It seems to me that the squeeze is going to be intense and probably lead us rapidly into destructive wars, like the one just started in the Middle East between Israel and Iran. Maybe it will be contained or maybe it won’t. But if destructive climate events are rapidly spiraling to greater intensity it also seems likely that our human emotions and actions will also spiral outward to greater levels of destruction across all realms of economics, politics, and social interaction.
What an excellent report. It deserves the widest readership both in the public arena and in policy-making circles. I am in agreement. "Hotter than expected - Sooner than expected." has been my mantra for years now. What I worry about is that even if society does everything right in terms of taking mitigating actions immediately, it will be too late. The momentum toward collapse is too strong if we look at society as a living organism, we can safely assume that it doesn't have infinite energy to achieve its goal. As its survival becomes threatened it will divert more and more of its energy to protecting itself at the expense of its other functions. That is the equation leading to its collapse.