


The Crisis Report - Notes for CR106
2024 marks the first time since record keeping began that all of the 10 hottest years have fallen within the most recent decade.


Is this about clouds?
Getting ready to write.
SO, I get a LOT of criticism on Reddit and Substack for “having no academic credentials”. I have been “shadow banned” on both the u/climate and u/climate change subreddits. The only subreddit I can post my climate articles/commentary on, is u/collapse.
This is the ONLY subreddit I can post my climate papers and comments on. The amount of hostility and outright hate I get on most of the other subreddits is amazing to me.
Even more amazing to me is that the Moderators of other subreddits tried to force the Mods on u/collapse to ban me. Apparently I annoy and outrage them SO MUCH that they think reddit users need to be protected from my writing.
One of their lines of attack is that I am “not qualified” to write on climate change because I have “no academic credentials” in the field. I mean, I only have a BS in Electrical Engineering/Computer Science from UC Berkeley, a Masters in the History of Technology, and a Doctorate in Anthropology. None of that matters to them. I don’t have a doctorate in a “climate science” field, so I cannot possibly understand anything about the Climate System.
As a result of their pressure campaign I am required to include the following disclaimer whenever I post my work.
MANDATORY DISCLAIMER:
I write and post on a number of sites and have been attacked for having no “academic credentials” in any field related to climate science. I do not wish to misrepresent myself as a “climate scientist” or “climate expert” to anyone who is reading this or any of my other climate related posts, so let us be clear:
I am not a climatologist, meteorologist, paleo-climatologist, geoscientist, ecologist, or climate science specialist. I am a motivated individual studying the issue using publicly available datasets and papers.
The analysis I am presenting is my own. I make no claim to “insider or hidden knowledge” and all the points I discuss can be verified with only a few hours of research on the Internet.
The analysis and opinion I present, in this and my other climate articles is exactly that: my opinion. I hope anyone reading it finds it useful, informative, and insightful but in the end, it is just my opinion.
What REALLY “chaps their hides” though isn’t my “supposed” ignorance. What really upsets them is that I am a “DOOMER”.
“Doomers” are WORSE than “Deniers” among the “Crisis Deniers” right now.
Outright denial of climate change has fallen out of favor in the last few years. Saying that you don’t “believe” in climate change increasingly marks you as the stupidest/worse sort of MAGAt mouth breathing, knuckle dragger. Fewer and fewer people openly cling to this position.
As the world as gotten hotter the “professional deniers” have changed with the times. They don’t deny the reality of climate change anymore because people can see/feel it for themselves now. Instead, they deny that it’s a “crisis” that needs to be aggressively addressed.
Telling people otherwise, REALLY sets them off. It can get you banned on Reddit.
The other BIG criticism of my articles is that I don’t include bibliographies for the papers and articles I cite/quote/reference. Which is fair, but irrelevant. I am not writing a scientific paper or a university assignment. I write for a popular audience and I think links are actually better than a bibliography anyway.
The implication though is that I don’t do any “real research”. That my articles are “superficial” and rely/repeat “junk science” which I “cherry pick” information from.
Their argument is that I should be SILENCED rather than be allowed to spread my “panic inducing misinformation”.
Well, you decide.
I am getting ready to do a major article, or series of articles discussing CLOUDS. This past December the AGU identified the recent acceleration in global warming as being the results of two things.
A reduction in tiny particles in the atmosphere called aerosols due to shipping fuel regulations that reduced sulfur oxide (SOx) emissions.
Decreasing cloud cover.
In my last piece I reviewed/discussed the SOx aerosol debate. In my next piece I will review/discuss the science around CLOUDS.
BECAUSE.
As I stated THREE YEARS ago.
Living in Bomb Time — 20 - Climate Report Part Three continued:…..Feb. 2022 smokingtyger.medium.com
“What Hansen is saying is that albedo has two components: clouds and haze. What the Earthshine and CERES projects are measuring is a decline in the Earth’s albedo. This could be caused by “cloud diminishment” as suggested by Goode.”
“Or it could be caused by a reduction in haze caused by a reduction in sulfur dioxide due to the changes in diesel fuels used by the global shipping industry, which is what Hansen is arguing.”
“This is an important question. There are serious implications from each of these scenarios.”
“If it’s a combination of both factors the ratio between them will be crucial. We will settle this issue over the next decade. What’s important for now is to be really clear about one thing.”
“Global warming has accelerated since 2014, almost doubling the rate of warming.”
HERE ARE MY READING/REFERENCE MATERIALS AND MY NOTES FOR MY NEXT ARTICLE.
This is NOT my article. This is me “doing research” and getting ready to write. You only need to browse through it if you are interested in the topic and want to read my source material.
For those of you who have wondered “what goes into?” Richard’s papers. I won’t do this again because this is a huge amount of stuff to plow through and because it’s unnecessary. Any of you could find ALL of the information here for yourselves.
I just condense it into an “easy to read” form. Because that's what “analysts” do.
:-)
ON CLOUDS
— — — — — — — — — — — — —
Historic 1985–2015 — ISCCP: Cloud Climatology
In order to predict the climate several decades into the future, we need to understand many aspects of the climate…isccp.giss.nasa.gov
notes:
Clouds affect the climate but changes in the climate, in turn, affect the clouds. This relationship creates a complicated system of climate feedbacks, in which clouds modulate Earth’s radiation and water balances.
Clouds cool Earth’s surface by reflecting incoming sunlight.
Clouds warm Earth’s surface by absorbing heat emitted from the surface and re-radiating it back down toward the surface.
Clouds warm or cool Earth’s atmosphere by absorbing heat emitted from the surface and radiating it to space.
Clouds warm and dry Earth’s atmosphere and supply water to the surface by forming precipitation.
Clouds are themselves created by the motions of the atmosphere that are caused by the warming or cooling of radiation and precipitation.
If the climate should change, then clouds would also change, altering all of the effects listed above.
if Earth’s climate should warm due to the greenhouse effect, the weather patterns and the associated clouds would change; but it is not known whether the resulting cloud changes would diminish the warming (a negative feedback) or enhance the warming (a positive feedback). (1983)
Their most important roles in climate are to modulate Earth’s basic radiation balance and to produce precipitation. The law of conservation of energy requires that the energy absorbed by the Earth from the sun balance the energy radiated by the Earth back into space. Clouds both reflect incoming sunlight and inhibit the radiation of heat radiation from the surface, thereby affecting both sides of the global energy balance equation.
Clouds also produce precipitation from water vapor, releasing heat to the atmosphere in the process (evaporation of water vapor from the surface cools it, so that these two processes serve to transfer heat from the surface to the atmosphere). Thus, any changes in clouds will modify the radiative energy balance and water exchanges that determine the climate.
The ways that clouds respond to changes in the climate are so complex that it is hard to determine their net effect on the energy and water balances and to determine how much climate might change.
What makes it so important to disentangle the interactions of clouds and climate? The balance between absorbed solar radiation and emitted heat radiation sets the temperature.
At the heart of the difficulty of understanding how clouds affect climatic change is that clouds both cool and heat the planet, even as their own properties are determined by the cooling and heating (current link). The cooling effect is literally visible: the minute water or ice particles in clouds reflect between 30 and 60 percent of the sunlight that strikes them, giving them their bright, white appearance. (Deep bodies of water, such as lakes and oceans, absorb more sunlight than they scatter and so appear very dark. If all of the cloud water in the atmosphere were placed on the surface, the layer depth would only be 0.05 mm on average. If all the water vapor in the atmosphere were reduced to a liquid water layer on the surface, the depth would be about 2 cm on average.) A cloudless Earth would absorb nearly 20 percent more heat from the sun than the present Earth does. To be in radiation balance Earth would have to be warmer by about 12°C (22°F). Thus, clouds can cool the surface by reflecting sunlight back into space, much as they chill a summer’s day at the beach.
The cooling effect of clouds is partly offset, however, by a blanketing effect: cooler clouds reduce the amount of heat that radiates into space by absorbing the heat radiating from the surface and re-radiating some of it back down. The process traps heat like a blanket and slows the rate at which the surface can cool by radiation. The blanketing effect warms Earth’s surface by some 7°C (13°F). Thus, clouds can heat the surface by inhibiting radiative heat loss, much as they warm a winter’s night.
The net effect of clouds on the climate today is to cool the surface by about 5°C (9°F). One can calculate that a higher surface temperature would result from the buildup of greenhouse gases in the atmosphere and the consequent slowing of heat radiation from the surface, provided nothing else changes. But what happens to the radiation balance if, as part of the climatic response, the clouds themselves change?
If the radiative cooling effect of clouds increases more than the heating effect does, the clouds would reduce the magnitude of the eventual warming. The same result could come about if both effects decrease, but the cooling decreases less than the heating does. On the other hand, if the cooling increases less (or decreases more) than the heating, the cloud changes would boost the magnitude of eventual warming.
Clouds are also part of another important internal heat exchange process involving water phase changes. Most of Earth’s “free” water is in the oceans (even more water is contained in the rocky crust of Earth), equivalent to a layer covering the whole surface about 2.5 km deep. Another 50 m of water is currently stored in the major ice sheets in Greenland and Antarctica. The atmosphere only contains about 2.5 cm of water and clouds contain only 0.05 mm. When water evaporates from the ocean and land surface, it cools the surface because it takes energy to change liquid/solid water into vapor. The atmospheric circulation transports water vapor from place to place. When the atmospheric motions include upward motions, the air cools and clouds form by condensing water vapor back to liquid/solid form. If the clouds produce no precipitation, then the energy released by the condensation of the cloud water is recaptured by the water vapor when the cloud water evaporates. However, if the clouds produce rain/snow, the energy released by the condensation heats the atmosphere. Because of the atmospheric transport of water vapor, the precipitation does not locally balance the evaporation, so the water vapor transport is equivalent to energy transport. The average evaporation and precipitation rates mean that all the water in the atmosphere is exchanged about once every 10 days. There is also a net transport of about 10% of the total water vapor evaporated from the oceans to the land, most of which is then returned to the oceans by rivers. Thus, the water cycle links the two parts of the radiation balance: the surface is heated by sunlight and cooled by water evaporation, but the atmosphere is heated by precipitation and cooled by terrestrial radiation to space. This water cycle is even more important to us because the small amount of water that is contained lakes and rivers or retained in underground water is our only supply of fresh water for drinking, agriculture and many other industrial and recreational uses.
the understanding of clouds is so rudimentary that no one knows whether climate feedbacks involving clouds will dampen or amplify a warming trend. The possibility that clouds might accelerate global warming brings a special urgency to the ancient problem of understanding the climatic importance of clouds.
How Clouds Form and Travel
A cloud is formed when atmospheric water vapor is cooled by vertical air motions (or in the polar regions by heat loss by radiation), condensing on microscopic airborne particles — dust, sea salt, bits of organic matter, or chemical aerosol particles, the most common beingcomposed of sulfuric acid and other sulfate compounds. Between the evaporation of water from the surface and its condensation in a cloud, water vapor is carried along by winds from warmer, moister regions to cooler, drier ones. Because the atmosphere, except for clouds, is nearly transparent to solar radiation, the surface absorbs 70 percent of the total solar heat taken up by the earth-atmosphere system, making the air warmer near the surface than it is at high altitudes. Because sunlight strikes the planet most directly near the equator, the tropics are warmer than the polar regions.
Both temperature gradients — the temperature variations from low to high altitudes and from low to high latitudes — are intensified by the effects of water vapor on radiative heating and cooling and by the transformations of water from liquid or solid into vapor and back. This happens because water vapor is nearly transparent at the wavelengths of sunlight (between 200 and 3,000 nm, nm = nanometer, one billionth of a meter), so it lets virtually all the sunlight reach the surface. However, water vapor is nearly opaque at the wavelengths at which the sunlight-warmed surface radiates away its absorbed energy (thermal radiation with wavelengths between 3,000 and 100,000 nm). The absorption of most of the outgoing thermal radiation by water vapor creates most of Earth’s natural greenhouse effect — an effect that is now being increased by human pollution. Without the atmospheric water vapor Earth’s surface would be, on average, about 31°C (55°F) colder than it is now and the differences in temperature between high and low altitudes and between the poles and equator would be smaller.
Since cold air is denser than warm air, temperature differences give rise to atmospheric motions that work to eliminate the density differences. Winds generally move warmer, moister air upward and poleward from the tropical surface and move colder, drier air downward and toward the equator from higher altitudes and latitudes. Although some water is transported to higher latitudes at upper levels, the winds nears the equator actually transport water vapor towards the equator, concentrating it into a narrow, heavy rainfall zone there. The contrasts in heating, together with the winds, also drive ocean currents, which help reduce the temperature differences between the equator and the poles even more.
Some of the water evaporated from the surface (primarily from the oceans) condenses into clouds and eventually falls as rain or snow. These transformations not only redistribute water but also play an important role in global heat transport. When surface water evaporates, the heat required to change liquid water into vapor is absorbed from the surface and carried along with the vapor into the air. When water vapor condenses into a cloud and falls as rain, it releases that heat, known as latent heat, into the air.
As the air moves past the particles in a cloud, there is a frictional force exerted, so that, even in very small clouds, the number of particles is sufficient to cause the air to move around the cloud rather than through it. Thus, smaller clouds are moved with the wind.
A doubling in atmospheric carbon dioxide (CO2), predicted to take place in the next 50 to 100 years, is expected to change the radiation balance at the surface by only about 2 percent. Yet according to current climate models, such a small change could raise global mean surface temperatures by between 2–5°C (4–9°F), with potentially dramatic consequences.
Simple Early Views of Clouds
The earliest attempts to predict how changes in cloud cover would affect greenhouse warming concluded that they would have no net effect: clouds would neither speed nor slow a change in climate. That conclusion was based on the belief that any change that made clouds better at cooling the Earth would also make them more efficient at retaining heat near the surface. For example, if cloud cover were to increase (as many thought it would, assuming that warmer temperatures would speed evaporation), the amount of sunlight reaching Earth’s surface would decrease, but then the thermal radiation trapped by the cloud might increase by the same amount.
Even such a simple scenario has problems, though. Because the decrease in solar heating would affect surface temperatures, whereas the change in the emission of thermal radiation would affect air temperatures at higher altitudes, additional cloud cover would reduce the temperature contrasts between the surface and the higher altitudes that drive the winds. Any reduction of winds might in turn inhibit the formation of clouds. The early studies did not account for this possibility.
Another idea is that higher atmospheric temperatures could create denser clouds, since greater evaporation rates at higher temperatures would make more water vapor available in the atmosphere for cloud condensation. Because denser clouds reflect more sunlight, there would be an enhanced cooling effect. This would reduce the magnitude of the greenhouse warming. On the other hand, denser clouds might also lead to an increase in precipitation (rainfall and snowfall), possibly from storm clouds, whose tops are especially high and cold. Such clouds, which are particularly good absorbers of thermal radiation, could more than make up for their tendency to block sunshine. In that case the warming would be intensified. Observations have shown, however, that warmer temperatures seems to create less dense, low-level clouds instead. The evidence we have so far suggests that this effect occurs because, as temperature increases, the air near the surface becomes drier, causing the cloud base to rise and reducing the cloud layer thickness. Earlier studies did not consider this possibility.
that clouds come in many forms , depending on the weather conditions that create them. Low, dense sheets of stratocumulus clouds hanging just above the ocean cool more than they heat. They make efficient shields against incoming sunlight, and because they are low — and therefore warm — they radiate upward almost as much thermal radiation as the surface does. In contrast, the thin, wispy cirrus clouds, which soar at 6,000 meters (20,000 feet) and higher, reflect little sunlight, but they are so cold that they absorb most of the thermal radiation that comes their way. Hence they warm more than they cool. The net cooling effect of clouds is the sum of a large number of such specific effects, many of which cancel one another.
The new global datasets show that clouds typically cover almost two-thirds of the planet, some 10 percent more than had been thought. Oceans are significantly cloudier than continents. Slightly more than 70 percent of the sky over oceans is cloudy, but a little less than 60% of the total land area is usually covered with clouds. Almost a fifth of the continental surface is covered by large areas of clear sky, whereas less than 10 percent of the ocean surface is. Clouds on average are about 27°C (48°F) colder than the surface is, and they reflect more than twice the amount of sunlight as the surface.
Cloud over the ocean, for instance, are different in some ways from clouds over land. The tops of ocean clouds are generally slightly more than a kilometer (3300 feet) lower than the tops of clouds over land, but ocean clouds reflect about 3% more sunlight on average than clouds over land. Above the oceans at low latitudes, clouds are more common in the morning than in the afternoon and the morning clouds are the most reflective of the day. Over land there are more clouds, with higher reflectivity, in the afternoon. Although clouds over oceans and land contain about the same amount of water on average, the low-level clouds over oceans are composed of fewer, but larger, droplets than are low-level clouds over land.
Cloud properties also vary with distance from the equator. The cloudiest regions are tropics and the temperate midlatitude storm zones; the subtropics and the polar regions have 10–20% less cloud cover. Tropical cloud tops are substantially higher, on average extending between one and two kilometers higher than cloud tops in the midlatitudes and more than two kilometers higher than the clouds over the subtropics and the north pole (clouds are much higher on average over the south pole because the ice sheet surface is so much higher in altitude). At some places in the tropics (the western Pacific Ocean, the Amazon River Basin and the Congo River Basin), cloud tops extend up to 15 kilometers (50,000 feet), occasionally higher. High-latitude clouds are almost twice as reflective as most clouds at lower latitudes.
2019
Extreme CO2 levels could trigger clouds ‘tipping point’ and 8C of global warming. -CarbonBrief, Zeke Hausfather, February 2019
Possible climate transitions from breakup of stratocumulus decks under greenhouse warming. -Nature Geoscience, February 2019.
notes:
“Stratocumulus clouds cover 20% of the low-latitude oceans and are especially prevalent in the subtropics. They cool the Earth by shading large portions of its surface from sunlight.”
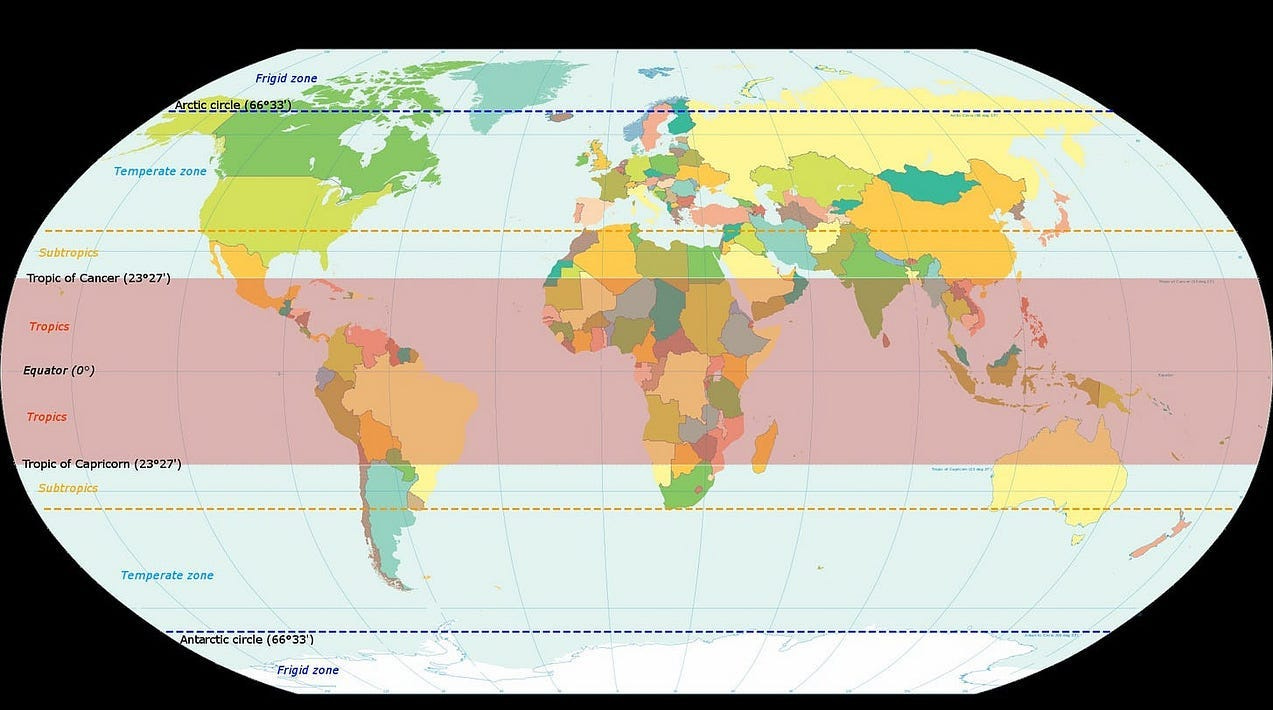
The band on each side of the tropics is the “sub tropics”.
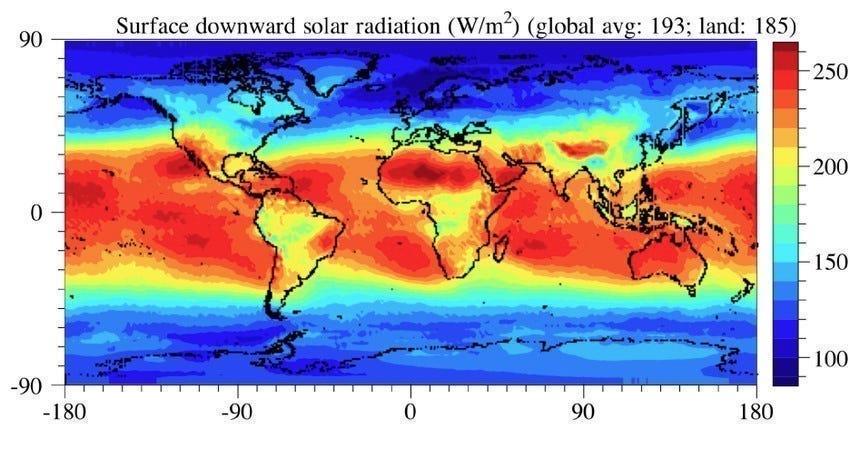
As you can see, these areas absorb a LOT of the solar energy that powers the Climate System.
“However, as their dynamical scales are too small to be resolvable in global climate models, predictions of their response to greenhouse warming have remained uncertain. Here we report how stratocumulus decks respond to greenhouse warming in large-eddy simulations that explicitly resolve cloud dynamics in a representative subtropical region.”
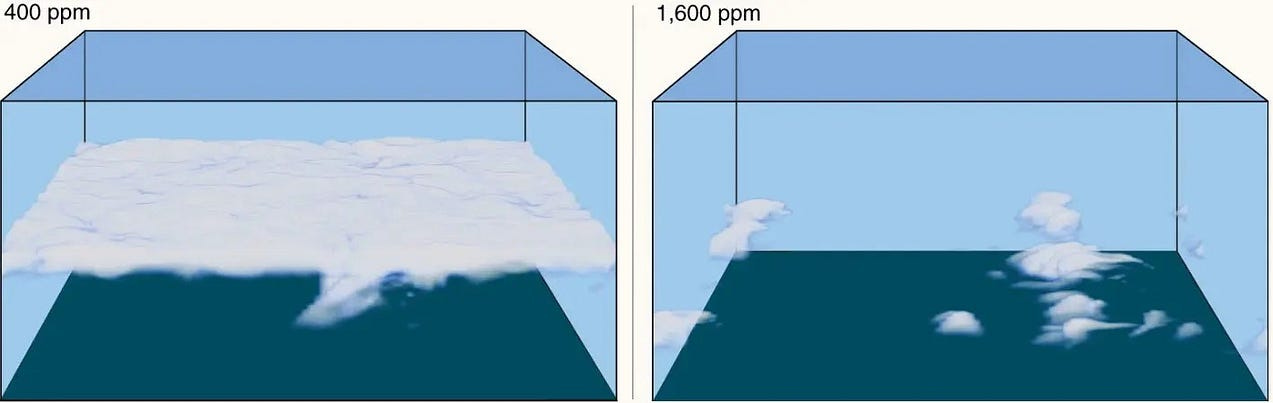
In the simulations, stratocumulus decks become unstable and break up into scattered clouds when CO2 levels rise above 1,200 ppm.
“In addition to the warming from rising CO2 levels, this instability triggers a surface warming of about +8C globally and +10C in the subtropics.”
Once the stratocumulus decks have broken up, they only re-form once CO2 concentrations drop substantially below the level at which the instability first occurred.
“Climate transitions that arise from this instability may have contributed importantly to hothouse climates and abrupt climate changes in the geological past. Such transitions to a much warmer climate may also occur in the future if CO2 levels continue to rise”.
2020
Causes of Higher Climate Sensitivity in CMIP6 Models…..Jan. 3, 2020 Geophysical Research Letters Volume 47, Issue 1
notes:
Abstract
Equilibrium climate sensitivity, the global surface temperature response to CO2 doubling, has been persistently uncertain. Recent consensus places it likely within 1.5–4.5 K. Global climate models (GCMs), which attempt to represent all relevant physical processes, provide the most direct means of estimating climate sensitivity via CO2 quadrupling experiments. Here we show that the closely related effective climate sensitivity has increased substantially in Coupled Model Intercomparison Project phase 6 (CMIP6), with values spanning 1.8–5.6 K across 27 GCMs and exceeding 4.5 K in 10 of them. This (statistically insignificant) increase is primarily due to stronger positive cloud feedbacks from decreasing extratropical low cloud coverage and albedo. Both of these are tied to the physical representation of clouds which in CMIP6 models lead to weaker responses of extratropical low cloud cover and water content to unforced variations in surface temperature. Establishing the plausibility of these higher sensitivity models is imperative given their implied societal ramifications.
Key Points
Climate sensitivity is larger on average in CMIP6 than in CMIP5 due mostly to a stronger positive low cloud feedback
This is due to greater reductions in low cloud cover and weaker increases in low cloud water content, primarily in the extratropics
These changes are related to model physics differences that are apparent in unforced climate variability
Plain Language Summary
The severity of climate change is closely related to how much the Earth warms in response to greenhouse gas increases. Here we find that the temperature response to an abrupt quadrupling of atmospheric carbon dioxide has increased substantially in the latest generation of global climate models. This is primarily because low cloud water content and coverage decrease more strongly with global warming, causing enhanced planetary absorption of sunlight — an amplifying feedback that ultimately results in more warming. Differences in the physical representation of clouds in models drive this enhanced sensitivity relative to the previous generation of models. It is crucial to establish whether the latest models, which presumably represent the climate system better than their predecessors, are also providing a more realistic picture of future climate warming.
Because GCMs attempt to represent all relevant processes governing Earth’s response to CO2, they provide the most direct means of estimating ECS. ECS values diagnosed from CO2 quadrupling experiments performed in fully coupled GCMs as part of the fifth phase of the Coupled Model Intercomparison Project (CMIP5; Taylor et al., 2012) ranged from 2.1 to 4.7 K (Andrews et al., 2012; Flato et al., 2014). It is already known that several models taking part in CMIP6 (Eyring et al., 2016) have values of ECS exceeding the upper limit of this range. These include CanESM5.0.3 (Swart et al., 2019), CESM2 (Gettelman et al., 2019), CNRM-CM6–1 (Voldoire et al., 2019), E3SMv1 (Golaz et al., 2019), and both HadGEM3-GC3.1 and UKESM1 (Andrews et al., 2019). In all of these models, high ECS values are at least partly attributed to larger cloud feedbacks than their predecessors.
Feb. 5, 2020 — Why Clouds Are the Key to New Troubling Projections on Warming
Recent climate models project that a doubling of atmospheric CO2 above pre-industrial levels could cause temperatures…e360.yale.edu
notes:
Recent climate models project that a doubling of atmospheric CO2 above pre-industrial levels could cause temperatures to soar far above previous estimates. A warming earth, researchers now say, will lead to a loss of clouds, allowing more solar energy to strike the planet.
It is the most worrying development in the science of climate change for a long time. An apparently settled conclusion about how sensitive the climate is to adding more greenhouse gases has been thrown into doubt by a series of new studies from the world’s top climate modeling groups.
The studies have changed how the models treat clouds, following new field research. They suggest that the ability of clouds to keep us cool could be drastically reduced as the world warms — pushing global heating into overdrive.
Clouds have long been the biggest uncertainty in climate calculations. They can both shade the Earth and trap heat. Which effect dominates depends on how reflective they are, how high they are, and whether it is day or night.
Recent concern about how accurately the models handle clouds has focused on the blankets of low clouds that any international flyer will have seen extending for hundreds of miles below them across the oceans. Marine stratus and stratocumulus clouds predominantly cool the Earth. They shade roughly a fifth of the oceans, reflecting 30 to 60 percent of the solar radiation that hits them back into space. In this way, they are reckoned to cut the amount of energy reaching the Earth’s surface by between 4 and 7 percent.
But it seems increasingly likely that they could become thinner or burn off entirely in a warmer world, leaving more clear skies through which the sun may add a degree Celsius or more to global warming. As Mark Zelinka of the Lawrence Livermore National Laboratory, lead author of a review of the new models published last month, has put it: The models “are shedding their protective sunscreen in dramatic fashion.”
The new predictions overturn a consensus about the planet’s climate sensitivity that has persisted for the entire 32-year history of the UN’s Intergovernmental Panel on Climate Change. All five of the IPCC’s scientific assessments have agreed that doubling carbon dioxide, the most critical planet-warming greenhouse gas, from pre-industrial levels will eventually warm us by about 3 degrees C (5.4 degrees F), with an error bar extending from a low of 1.5 degrees C (2.7 degrees F) to a high of 4.5 degrees C (8 degrees F). This is known in the jargon as the equilibrium climate sensitivity.
That consensus was reaffirmed in 2018 when a widely cited review, headed by Peter Cox of the University of Exeter, found that the chance of climate sensitivity exceeding 4.5 degrees was “less than 1 percent.”
But the consensus has now been blown apart. Most leading climate models — including those from the U.S. National Center for Atmospheric Research (NCAR) and Britain’s Hadley Center — are now calculating the climate’s sensitivity to doubling CO2 levels as a degree or more higher, ranging up to 5.6 degrees C (10 degrees F).
A lot of the water vapor in the air forms water droplets that coalesce into clouds. We generally think of clouds as keeping us cool, and more water vapor should make more clouds. That may sound helpful. But things are not so simple.
While during the day, low clouds shade the planet, at night they act as an insulating blanket. Meanwhile high cirrus clouds predominantly act as heat traps, warming the air below them. Generally, at a global level, models have suggested that the warming and cooling effects cancel each other out, and the presumption has been that that will continue as the world warms. But the new model analyses suggest otherwise.
At a meeting in Barcelona last March, climate modelers first began to realize that most of the world’s leading climate models were rejecting the old IPCC consensus. The data is now increasingly becoming public. First, in July, Andrew Gettelman at NCAR reported that the center’s revised modeling came up with a climate sensitivity — the temperature increase based on a projected doubling of CO2 levels — of 5.3 degrees C (9.5 degrees F), a 32 percent increase over its previous estimate of 4 degrees C.
Clouds would thin out and many would not form at all, resulting in extra warming.
Others soon followed. Last month, American and British researchers, led by Zelinka, reported that 10 of 27 models they had surveyed now reckoned warming from doubling CO2 could exceed 4.5 degrees C, with some showing results up to 5.6 degrees. The average warming projected by the suite of models was 3.9 degrees C (7 degrees F), a 30-percent increase on the old IPCC consensus.
French scientists at the National Center for Scientific Research concluded that the new models predicted that rapid economic growth driven by fossil fuels would deliver temperature rises averaging 6 to 7 degrees C (10.8 to 12.6 degrees F) by the end of the century. They warned that keeping warming below 2 degrees C was all but impossible.
Zelinka said the new estimates of higher climate sensitivity were primarily due to changes made to how the models handled cloud dynamics. The models found that in a warmer world clouds would contain less water than previously thought. Clouds would thin out, and many would not form at all, resulting in “stronger positive cloud feedbacks” and extra warming.
This tweaking of the models followed recent field research over the Southern Ocean, which is currently one of the cloudiest regions on Earth. Flying through those clouds, researchers found they contain much more water and less ice than previously assumed. They were “optically thicker and hence more reflective of sunlight,” says NASA’s Ivy Tan.
That sounds like good news. But it means that past models have overestimated how much ice in these clouds will turn to liquid water in a warmer world — and so overestimated both the thickness of future clouds and their ability to keep us cool. Eliminating that bias, says Tan, could increase climate sensitivity by as much as 1.3 degrees C.
Real-world data from satellites suggests that the modelers’ predictions may already be coming true.
Modelers have also changed how they characterize the effect of anthropogenic aerosols from burning fuel, particularly in clouds. In general, the aerosols make clouds thicker and better able to shade the planet. The recent recalculation follows new estimates of aerosol emissions during the mid-20th century, a time when booming emissions from rapid industrialization caused the planet to cool for several decades, masking the warming effect of accumulating CO2.
Researchers have concluded from the new data that both the cooling effect of aerosols and the warming effect of CO2 have been greater than previously supposed, causing them to revise upward their estimates of the climate’s sensitivity to CO2. With CO2 continuing to accumulate and stricter controls on smog, the masking effect of particulate aerosols is bound to diminish in the future. So the increased climate sensitivity to CO2 is set to dominate, giving an extra kick to warming.
Real-world data from satellites suggests that the modelers’ predictions may already be coming true. Norman Loeb of NASA’s Langley Research Center has shown that a sharp rise in global average temperatures since 2013 has coincided with a decline in cloud cover over the oceans. He argues that the clearer skies may have resulted from stricter pollution controls in China and North America.
Other researchers have reported fewer low-level clouds in the tropics during warmer years. In his 2016 study, climate scientist Tapio Schneider, then at ETH Zurich, noted that climate models that incorporated this link in their calculations predicted faster global warming.
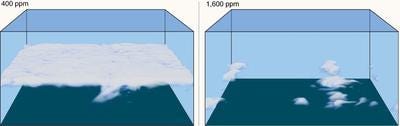
A model of clouds in current and future atmospheric CO2 concentrations, showing a shift from stratocumulus clouds to scattered cumulus clouds, which would result in strong warming. Schneider et al. Nature 2019
Schneider, now at Caltech, made waves last February by arguing that global cloud cover may have a tipping point, beyond which clouds would “become unstable and break up,” sending warming into an upward spiral. He used a model with a fine-scale resolution that, he said, represented the real dynamics of clouds much better than the models used to calculate climate change.
The tipping point would not be reached until CO2 levels were at around 1200 ppm, more than four times pre-industrial levels, and three times current levels. But once it was passed, he projected that temperatures would soar by an additional 8 degrees C (14.4 degrees F) as a result of the lost clouds. He suggested that such a tipping point “may have contributed importantly to abrupt climate changes in the geological past.”
This is not the first time that such scary climate predictions have emerged from modeling analysis of how clouds might change in a warmer world. Fifteen years ago, I attended a workshop of climate modelers where James Murphy of Britain’s Hadley Centre discussed how he had tweaked his center’s standard climate model to reflect more fully the uncertainty about cloud cover, cloud duration, and thickness. The resulting graph showed the most likely warming still at 3 degrees C or so, but with a “long tail” at the top end. There was a possibility — he put it no higher — that warming could go as high as 10 degrees C (18 degrees F) for doubling CO2.
David Stainforth of Oxford University had done the same thing on another model and saw a “long tail” extending to 12 degrees C. They both later published their findings in Nature, but the findings were subsequently rather sidelined by modelers. They did not make it into summaries of IPCC climate science assessments.
2021
An underestimated negative cloud feedback from cloud lifetime changes…..Jun. 03, 2021 Nature — Climate Change
notes:
Abstract
As the atmosphere warms, part of the cloud population shifts from ice and mixed-phase (‘cold’) to liquid (‘warm’) clouds. Because warm clouds are more reflective and longer-lived, this phase change reduces the solar flux absorbed by the Earth and constitutes a negative radiative feedback. This cooling feedback is weaker in the sixth phase of the Coupled Model Intercomparison Project (CMIP6) than in the fifth phase (CMIP5), contributing to greater greenhouse warming.
Although this change is often attributed to improvements in the simulated cloud phase, another model bias persists: warm clouds precipitate too readily, potentially leading to underestimated negative lifetime feedbacks. In this study we modified a climate model to better simulate warm-rain probability and found that it exhibits a cloud lifetime feedback nearly three times larger than the default model. This suggests that model errors in cloud-precipitation processes may bias cloud feedbacks by as much as the CMIP5-to-CMIP6 climate sensitivity difference. Reliable climate model projections therefore require improved cloud process realism guided by process-oriented observations and observational constraints.
Clouds could have a greater cooling effect on the planet than climate models currently suggest, according to new…www.carbonbrief.org
notes:
The paper, published in Nature Climate Change, aims to correct a “long-standing” and “unaddressed” problem in climate modelling — namely, that existing models simulate too much rainfall from clouds and, therefore, underestimate their lifespan and cooling effect.
The authors have updated an existing climate model with a more realistic simulation of rainfall from “warm” clouds — those that contain water only, rather than a combination of water and ice. They find that this update makes the “cloud-lifetime feedback” — a process in which warmer temperatures increase the lifespan of clouds — almost three times bigger.
The authors note that the newest generation of global climate models — the sixth Coupled Model Intercomparison Project (CMIP6) — predicts faster future warming than its predecessors. This is largely because the new models simulate a smaller cooling effect from clouds.
However, the lead author of the study tells Carbon Brief that fixing the “problem” in rainfall simulations “reduces the amount of warming predicted by the model, by about the same amount as the warming increase between CMIP5 and CMIP6”.
Due to this, he says that the key takeaway from the study is to “take the extra warming in CMIP6 with a grain of salt until some of the other known cloud problems are also fixed in the models”.
As the climate warms, scientists expect many clouds to transition from “cool” to “warm”. Cool clouds are made up of a mixture of ice particles and water droplets, while warm clouds contain only liquid. This phase transition will affect the cooling properties of clouds in two main ways.
First, the water droplets in clouds are usually smaller than the ice particles, giving them a larger surface area to mass ratio and allowing them to reflect sunlight more easily. This means that as clouds transition from cool to warm, they become more reflective. The paper calls this the “optics component” of the phase feedback.
Second, warm clouds are less efficient at precipitation — meaning that they do not begin to release raindrops as readily as cold clouds. By raining less often, warm clouds achieve a longer lifespan — this is called the “lifetime component” of the phase feedback.
Dr Kate Marvel, an associate research scientist at Columbia University and the NASA Goddard Institute for Space Studies, who was not involved in the study, tells Carbon Brief that, due to the optics and lifetime components of the cloud feedback, “if you make the clouds more liquid, they block more sunlight and last longer”.
in the 2010s, a number of studies were published “showing that climate model clouds contain far more ice than satellite observations support” — indicating that CMIP5 models were underestimating the amount of liquid contained in clouds.
Climate modellers around the world took notice of these papers and set about updating their models. When the subsequent suite of models — the sixth Coupled Model Intercomparison Project — were released, many included a greater cloud liquid fraction.
This change in cloud modelling had the knock-on effect of increasing the “equilibrium climate sensitivity” — the amount of warming that the planet will see in response to a doubling of CO2 levels — in many CMIP6 models.
Mülmenstädt explains that this was “one of the big surprises coming out of CMIP6”, and was “in large part” due to changes in modelling extratropical, low clouds over the Southern Ocean. Marvel confirms that “most of the increases in climate sensitivities between CMIP5 and CMIP6 climate models come from changes to how models simulate clouds”.
The high climate sensitivity of CMIP6 models attracted widespread attention within the scientific community, as a higher climate sensitivity means that future warming will be more rapid and intense than previously thought.
However, the representation of warm clouds in CMIP6 models is still imperfect. In this study, the authors highlight a significant “error” in cloud rainfall processes — that warm clouds in CMIP6 models produce too much rain. To show the extent of the error, the authors update an existing climate model to include a more accurate warm-rain probability and then compare its results to the original model.
fixing this cloud-lifetime effect could have as great of an impact on future warming predictions as the change from CMIP5 to CMIP6 models did:
“Liquid clouds in climate models rain too much. We found that fixing that problem in the model we studied reduces the amount of warming predicted by the model by about the same amount as the warming increase between CMIP5 and CMIP6. So the main message is: take the extra warming in CMIP6 with a grain of salt until some of the other known cloud problems are also fixed in the models.”
The top map shows the warm-rain fraction in the present-day climate, where red indicates a high fraction and blue a low fraction. The bottom map shows how the warm-rain fraction could change in a 4C warmer future, relative to the present-day climate, where red indicates an increase in warm-rain fraction, and blue indicates a decrease.
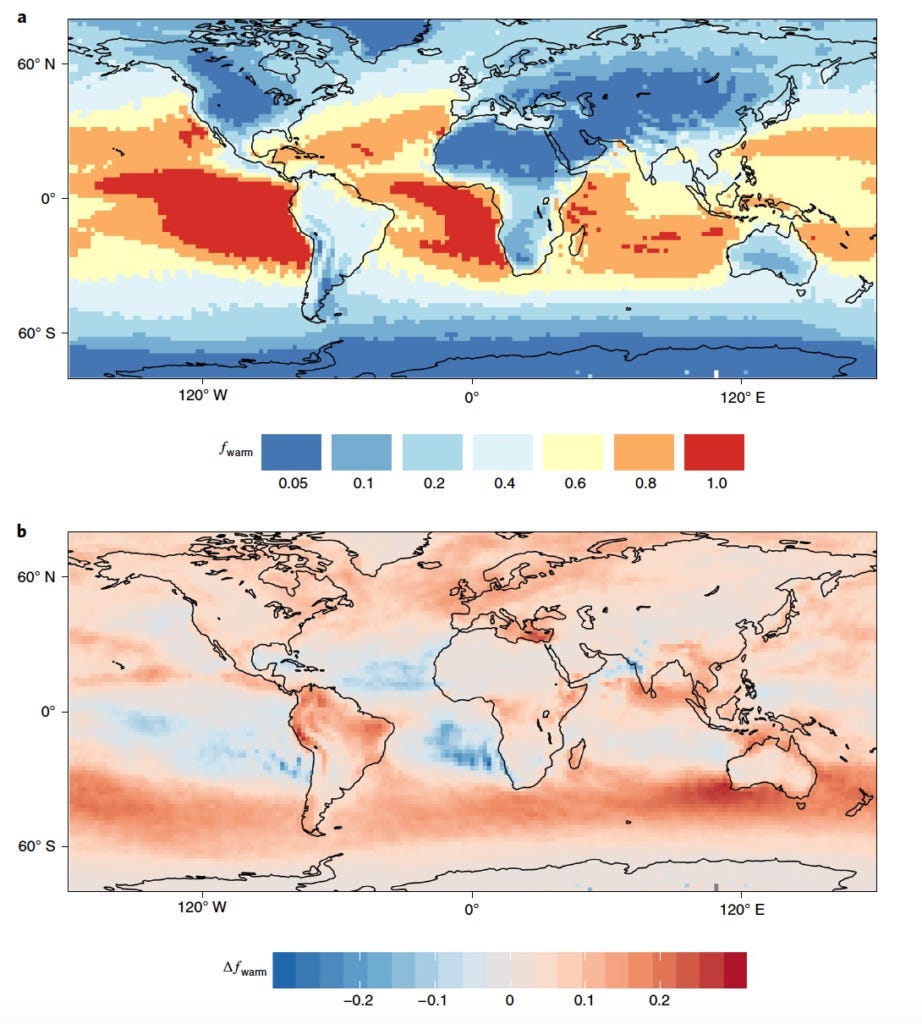
The maps show that the majority of warm-rainfall processes occur near the equator, where temperatures are highest, and that they are particularly prevalent over the ocean. As the planet warms, the increase in warm-rain fraction is particularly pronounced in the southern hemisphere mid-latitudes, while it is expected to drop over the sea at low latitudes.
The authors correct the rainfall processes by using satellite data to determine how much rain falls from clouds in the present-day climate. They then modify the warm-rain processes in the climate model to match up more accurately with the satellite-observed probability of rainfall.
The plot below shows the probability of rainfall from warm clouds at different latitudes, as observed using satellite data (grey), and modelled using the original model (red) and updated model (yellow).

Compensation Between Cloud Feedback and Aerosol-Cloud Interaction in CMIP6 Models…..Jan. 25, 2021
notes:
Abstract
The most recent generation of climate models (the 6th Phase of the Coupled Model Intercomparison Project) yields estimates of effective climate sensitivity (ECS) that are much higher than past generations due to a stronger amplification from cloud feedback. If plausible, these models require substantially larger greenhouse gas reductions to meet global warming targets. We show that models with a more positive cloud feedback also have a stronger cooling effect from aerosol-cloud interactions. These two effects offset each other during the historical period when both aerosols and greenhouse gases increase, allowing either more positive or neutral cloud feedback models to reproduce the observed global-mean temperature change. Since anthropogenic aerosols primarily concentrate in the Northern Hemisphere, strong aerosol-cloud interaction models produce an interhemispheric asymmetric warming. We show that the observed warming asymmetry during the mid to late 20th century is more consistent with low ECS (weak aerosol indirect effect) models.
Key Points
Models with more positive cloud feedback tend to have more negative aerosol-cloud interaction
This compensation relationship enables the models to match the historical warming even with a large spread in climate sensitivity
Historical interhemispheric warming indicates the high climate sensitivity models overestimate the aerosol-cloud interaction
Plain Language Summary
The response of clouds to surface temperature change can amplify or dampen the greenhouse gas induced warming, also known as cloud feedback. We find that in the latest generation of climate models, those models with a more positive cloud feedback tend to have a stronger cooling effect from aerosol-cloud interaction. The compensation between cloud feedback and aerosol-cloud interaction enables models to reproduce the historical global-mean temperature change. In spite of having significantly different surface temperature sensitivity to increasing CO2, the historical record of global-mean temperature is not a strong constraint in distinguishing these models. However, the interhemispheric difference in temperature over the 20th century provides a constraint that distinguishes the models that have a large or small sensitivity to increasing CO2. Over the 20th century, changes in anthropogenic aerosols were mostly concentrated in the Northern Hemisphere. Consequently, models with strong or weak aerosol-cloud interactions produce different warming asymmetry over the historical period, and the observed warming asymmetry is more consistent with the models that have weak aerosol-cloud interactions (and less positive cloud feedback).
Clouds exert a profound influence on global climate by modulating the flow of energy through the atmosphere. The radiative effects of clouds are complex: clouds can both cool climate by reflecting incoming sunlight and warm it by absorbing and reemitting thermal radiation (Ramanathan et al., 1989). The net impact of these competing effects depends on the distribution, macrophysical, and microphysical properties of clouds (Hartmann et al., 1992). As the planet warms from increasing greenhouse gases (GHGs), it is not yet clear whether changes in cloud properties will further amplify or dampen the GHGs induced warming, or by how much. Uncertainties in predicting this radiative feedback from clouds are the largest cause of spread in model predictions of future global warming (Boucher et al., 2013; Ceppi et al., 2017; Zelinka et al., 2020).
Current estimates of cloud feedback range from effectively neutral to substantially positive in response to GHGs forcing (Chung & Soden, 2015; Vial et al., 2013; Zelinka et al., 2013, 2016). The latest climate models from the Sixth Phase of the Coupled Model Intercomparison Project (CMIP6) has produced a number of models with significantly higher effective climate sensitivity (ECS) compared to previous generations (Zelinka et al., 2020). This higher ECS has been shown to result primarily from a more positive cloud feedback in models. The ECS ranges from 1.8 to 5.6 K in the CMIP6 models, with seven of them having an ECS greater than 4.7 K, the upper bound of ECS in CMIP5 (Andrews et al., 2012; Flato et al., 2014).
In addition to changes in GHGs, climate forcing over both the historical era and projected future scenarios involve changes in aerosols. Interactions between clouds and aerosols are complex and also influence the radiation budget (Penner et al., 1992). Aerosols affect the radiation directly by scattering and absorbing incoming sunlight. Additionally, aerosols can act as cloud condensation nuclei, change the cloud droplet size and alter cloud albedo, and cloud lifetime, modulating the radiation budget (Rotstayn & Penner, 2001; Twomey, 1977). The indirect effects are both highly uncertain and often larger than the direct radiative impact of aerosols (Lohmann et al., 2010; Myhre et al., 2013; Smith et al., 2020; Zelinka et al., 2014).
In this study, we show that models with a more positive cloud feedback in response to increasing GHGs also tend to have a stronger cooling effect from aerosol-cloud interactions (ACI). These two effects offset each other during much of the 20th century, when both anthropogenic aerosols and GHGs emissions increased. Thus, both models with low and high ECS are able to reproduce the observed changes in global-mean temperature. However, this compensation does not occur in future emission scenarios where aerosols are projected to decrease as CO2 and other GHGs continue to increase. We will show that the interhemispheric temperature contrast over the historical period provides a way to distinguish between low and high ECS models. Also, we find that models with a lower ECS (and weaker ACI) are more consistent with the observed interhemispheric asymmetric warming pattern during the 20th century.
The “smoking gun”
Interhemispheric Warming Asymmetry
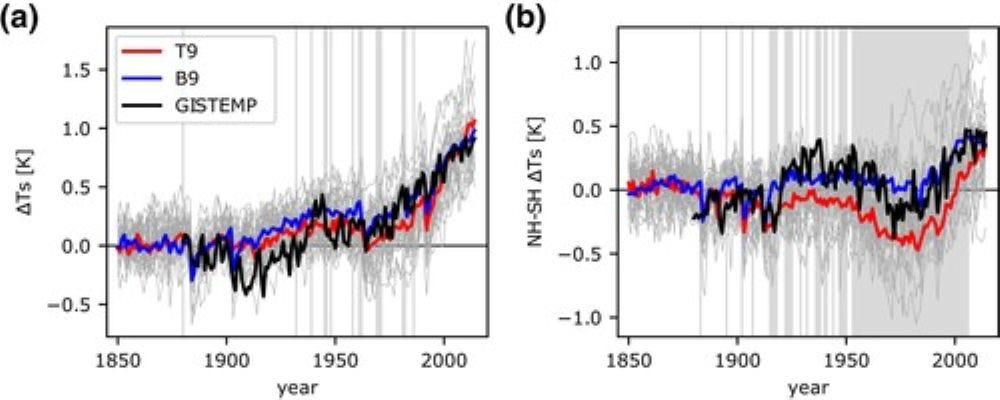
Due to the larger cooling effect of the ACI, T9 models simulate slightly colder surface temperature anomalies during the mid to late 20th century compared to the B9 models (Figure 4a), even though the T9 models have a more positive cloud feedback and a higher ECS. While this difference between the B9 and T9 models’ surface temperature anomaly is small when globally averaged (and only few scattered years are significantly different — indicated by the gray shading), the hemispheric asymmetry of the historical aerosol forcing induces substantial differences in the interhemispheric warming asymmetry (Figure 4b). Here, we use the surface temperature change in Northern Hemisphere minus that in the Southern Hemisphere to evaluate the interhemispheric warming asymmetry. The meridional asymmetry in the temperature evolution over the late 20th century distinguishes the T9 and B9 models: the T9 models warm more in the SH than the NH during the last century, and the differences in the interhemispheric warming asymmetry between the T9 and B9 models are significant during 1950–2000 (gray shading in Figure 4b).
The observed interhemispheric warming asymmetry over the 20th century is more consistent with the models with weaker cloud feedback and aerosol indirect effect (B9) than those with more positive cloud feedback and aerosol indirect effect (T9). Although the observed global- and annual-mean temperature anomalies are broadly consistent with both sets of models (Figure 4a), the B9 model ensemble mean of B9 more closely reproduces the observed hemispheric contrast in warming over most of the historical period (Figure 4b). The rank of the observed NH-SH temperature anomaly pooled from the B9 model ensemble produces an approximately uniformly distribution, but pooling from T9 model ensemble produces a skewed distribution, indicating that the B9 model ensemble is a more reliable representation (Figure S1).
The seeming consistency of global-mean temperature evolution between more positive cloud feedback (high ECS) models and observations requires a strong aerosol indirect cooling effect that leads to an interhemispheric temperature evolution that is inconsistent with observations. Because of the strong negative correlation between a model’s cloud feedback in response to CO2 (and its CO2-induced ECS) and its aerosol indirect effect (Figure 1b), the global-mean temperature evolutions in more positive and less positive cloud feedback models are not well separated over the historical period (Figure 4a) as both CO2 and aerosol increase. Both more positive (high ECS) and less positive (low ECS) cloud feedback models are able to simulate the observed global-mean temperature record, but T9 models do it through a combination of strong warming from GHGs and strong cooling from aerosols, while B9 models do it with moderate warming from GHGs and modest cooling from aerosols. Because historical aerosol forcing has been larger in the Northern Hemisphere, the strong ACI cooling effect in T9 models produces a distinctive historical interhemispheric surface temperature evolution (red line in Figure 4b), which is inconsistent with that in observations over 1950–2000 (black line in Figure 4b). These results support the recent findings that the CMIP6 models more faithfully capture the observed evolution of surface anomalies across a range of quantities over 1980–2014 tend to have lower 21st century projected warming (Brunner et al., 2020).
Reproducing the observed global-mean temperature evolution over the 20th century is an important test for climate models. It seems unlikely that a model with a more positive cloud feedback and a weak ACI, or vice-versa, could achieve this important benchmark. Thus, the compensation could result from implicit or explicit efforts to tune the representation of clouds in models to reproduce the observed global-mean temperature record when forced with historical emissions (Mauritsen & Roeckner, 2020; Schmidt et al., 2017).
Then we had the 2023/2024 El Nino.
2024
Observations and models indicate that human activity is altering cloud patterns on a global scale. Clouds impact…www.frontiersin.org
notes:
Observations and models indicate that human activity is altering cloud patterns on a global scale. Clouds impact incident visible and infrared radiation during both day and night, driving daily and seasonal variability in plant temperatures — a fundamental driver of all physiological processes. To understand the impacts of changing cloud patterns on essential plant-based processes such as carbon sequestration and food production, changes in local cloud regimes must be linked, via ecophysiology, with affected plant systems
This review provides a comprehensive treatment of cloud effects (apart from precipitation) on fundamental ecophysiological processes that serve as the basis of plant growth and reproduction. The radiative effects of major cloud types (cumulus, stratus, cirrus) are differentiated, as well as their relative impacts on plant microclimate and physiology. Cloud regimes of major climate zones (tropical, subtropical, temperate, polar) are superimposed over recent changes in cloud cover and primary productivity.
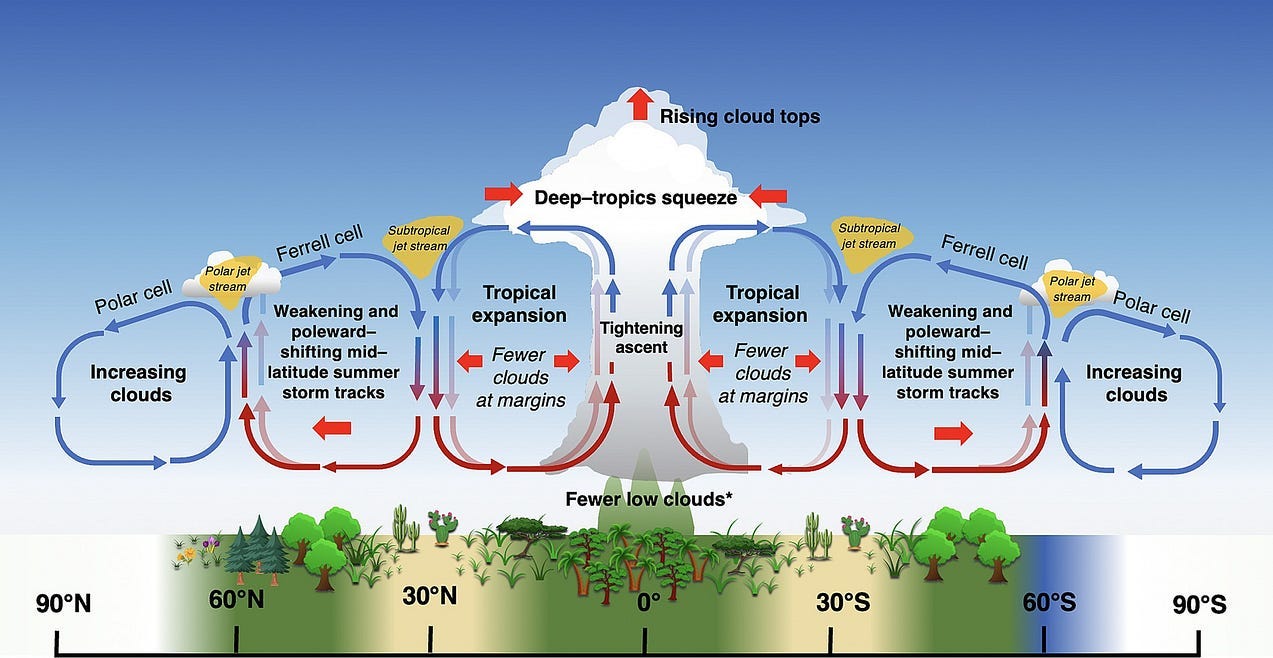
The most robust trends in changing global cloud patterns include: (i) the tropical rain belt (comprised mostly of deep convective clouds) is narrowing, shifting latitudinally, and strengthening, corresponding with shorter but more intense rainy seasons, increased clouds and precipitation in some parts of the tropics, and decreases in others; (ii) tropical cyclones are increasing in intensity and migrating poleward; (iii) subtropical dry zones are expanding, resulting in fewer clouds and drier conditions at these latitudes; (iv) summer mid-latitude storm tracks are weakening and migrating poleward, and clouds in temperate regions are decreasing; and (v) clouds over the Arctic are increasing.
A reduction in coastal fog and low clouds (including those associated with montane cloud forests) have also been observed, although these trends can be partially attributed to local patterns of deforestation, urbanization, and/or reductions in aerosols associated with clean air initiatives.
Clouds cover approximately 71% of the Earth’s surface and play an important role in the energy balance of the planet (L’Ecuyer et al., 2019). By reflecting incoming shortwave radiation back into space, clouds cool the planet during the day, and through absorption and re-emission of longwave, infrared radiation emitted by the Earth’s surface and atmosphere, also contribute to its warming. Tropospheric warming can further impact cloud phase (liquid/ice) and height, either dampening or amplifying warming (i.e., cloud feedback effects) (Ceppi et al., 2017; Ceppi and Nowack, 2021). Through these radiative effects, clouds contribute to daily and seasonal variability in plant temperatures, a fundamental driver of all physiological processes (Figure 1). Clouds also impact plant water status directly, through foliar uptake of fog/cloud water, and indirectly, as irradiance impacts evaporation and soil moisture (Figure 1).

Changes in clouds under CO2-forced warming have been considered one the most critically important, but also most challenging, aspects of climate modeling (Warren et al., 2007). Cloud feedback effects, specifically, represent the single largest source of uncertainty in climate models (Ceppi et al., 2017). For these reasons, clouds are considered a “wild card” of successful global climate change models (Scholes et al., 2015).
Linking changes in global and regional cloud patterns with the predicted responses of affected plant systems is critical for developing accurate carbon assimilation models (Schneider et al., 2017), as well as informing local and global policy makers, conservation efforts, and agricultural communities.
In the current review, we aim to add to the discussion of cloud impacts on plant physiology in the context of climate change by: (i) differentiating between the radiative impacts of different major cloud types (e.g., cirrus, cumulus, stratus) (Section 2); (ii) expanding the discussion of cloud effects on shortwave (SW) radiation and plant productivity to include longwave and water-related impacts (excluding precipitation) (Section 3); and (iii) overlaying changes in global cloud cover with observed and predicted ecophysiological responses of plants in affected ecosystems (Section 4).
Geographic regions vary distinctly in local cloud regimes — a term which encompasses both total cloud amount and the relative frequency of occurrence of major cloud types (Jakob and Tselioudis, 2003). Because specific cloud regimes tend to exhibit comparable micro- and macro-physical properties (Sedlar et al., 2021), classifying cloud effects by regime can be useful for extrapolating physiological findings to lesser-studied, but meteorologically-similar ecosystems, as well as fine-tuning predicted responses of native, invasive, and agricultural plant systems to climate change.
Clouds may be characterized by height (low, mid, and high-level clouds), optical depth (i.e., the ratio of irradiance at the surface relative to a clear day), or form (e.g., cumulus, stratus, and cirrus; Figure 2). Low clouds (cloud top pressure, or Pc > 680 mb) are primarily composed of water droplets, and include cumulus and low stratus clouds (e.g., fog). Mid-level clouds are often multi-state, comprised of both water droplets and/or ice crystals, and include high cumulus and stratus (i.e., altocumulus and altostratus, respectively) (Chen et al., 2000). High clouds (Pc < 440 mb) are composed of ice particles, and include cirrus, cirrostratus, and anvil-topped clouds associated with deep convection (Chen et al., 2000).
Clouds are not distributed evenly around the globe, either in frequency or type (Eastman and Warren, 2013; L’Ecuyer et al., 2019; Figure 6A). Latitudinal trends in cloud cover are governed primarily by largescale patterns of convection driven by uneven heating of the earth’s surface. Rising temperatures, disproportionately in the Arctic, impact the thermal gradients which drive these air circulation patterns, affecting cloud height, frequency, morphology, and distribution worldwide (summarized by climatic zone in the following sections). Eastman and Warren (2013) provide a useful surface-based cloud climatological atlas describing diurnal, seasonal, and multi-decadal trends for each major cloud type over a 39 year period.1

In addition to global patterns of convection, regional factors also impact cloud formation over land. These include mountains (orographic lifting), transpiration from vegetation, land cover change, and the presence of condensation nuclei (e.g., aerosols, pollution, salt spray) (Boucher et al., 2013; Ray, 2013; Yan et al., 2020; Spiridonov and Ćurić, 2021). Clouds nucleated on aerosols may be brighter, as they tend to be composed of higher concentrations of smaller water droplets (Rosenfeld et al., 2008). Such clouds are longer-lived and less likely to form precipitation (Ten Hoeve et al., 2012 and citations therein). “Brown clouds” comprised of carbonaceous aerosols have also been associated with large-scale deforestation in many locations around the globe (Ramanathan et al., 2007). Darkly-colored aerosols, including those associated with forest fires, can promote cloud formation at low concentrations by acting as condensation nuclei; however, cooling effects are reversed at higher concentrations, as atmospheric warming favors evaporation of low clouds and formation of high clouds from resulting updrafts (Ten Hoeve et al., 2012; Liu et al., 2020). Notably, reductions in atmospheric pollutants associated with clean-air initiatives have been implicated in localized reductions in low cloud cover and optical thickness at several locations around the globe (Yan et al., 2020; Watson-Parris et al., 2022).
Deforestation also impacts cloud formation regionally by interrupting the recycling of soil water back into the atmosphere via evapotranspiration, and reducing atmospheric water vapor available for cloud formation and precipitation (Staal et al., 2020; Xu et al., 2022). Warmer surface temperatures in deforested areas also increase the altitude at which overlying clouds form (Lawton et al., 2001; Ray, 2013), similarly to urban heat islands (Williams et al., 2015; Yan et al., 2020).
Finally, most models agree that cloud top and cloud base heights are increasing on average globally, although the magnitude of the latter varies widely regionally and across models (Prein and Heymsfield, 2020; Zelinka et al., 2020). These changes have been attributed to a variety of global and regional factors, including warmer air temperatures (which increase the height at which condensation occurs), pollution, urbanization, and interruption of the hydrological cycle by deforestation (Lawton et al., 2001; Ray, 2013; Williams et al., 2015; Yan et al., 2020). However, cloud base heights are not increasing everywhere. In fact, in regions where atmospheric moisture, clouds, and precipitation are increasing, clouds bases have been lowering (e.g., India; Figure 6B). The most dramatic lifting of cloud bases occurs in regions with atmospheric drying (e.g., tropical America and Africa; Los et al., 2021). As described previously, regional patterns of air pollution and deforestation also play a role.
Substantial cooling effect from aerosol-induced increase in tropical marine cloud cover…..Apr. 11, 2024 Nature Geoscience
notes:
Abstract
With global warming currently standing at approximately +1.2 °C since pre-industrial times, climate change is a pressing global issue. Marine cloud brightening is one proposed method to tackle warming through injecting aerosols into marine clouds to enhance their reflectivity and thereby planetary albedo. However, because it is unclear how aerosols influence clouds, especially cloud cover, both climate projections and the effectiveness of marine cloud brightening remain uncertain. Here we use satellite observations of volcanic eruptions in Hawaii to quantify the aerosol fingerprint on tropical marine clouds. We observe a large enhancement in reflected sunlight, mainly due to an aerosol-induced increase in cloud cover. This observed strong negative aerosol forcing suggests that the current level of global warming is driven by a weaker net radiative forcing than previously thought, arising from the competing effects of greenhouse gases and aerosols. This implies a greater sensitivity of Earth’s climate to radiative forcing and therefore a larger warming response to both rising greenhouse gas concentrations and reductions in atmospheric aerosols due to air quality measures. However, our findings also indicate that mitigation of global warming via marine cloud brightening is plausible and is most effective in humid and stable conditions in the tropics where solar radiation is strong.
Main
Aerosol-induced increases in liquid cloud opacity cool the Earth by enhancing reflection of sunlight back to space and offset a large, yet poorly quantified, portion of greenhouse gas warming1. The climate impacts of aerosol–cloud interactions (ACI) have been widely debated in the past few decades and still constitute one of the largest uncertainties in the estimate of radiative forcing1,2,3, impeding a better understanding of climate sensitivity4 and the remaining carbon emissions budget for avoiding overshooting the +1.5 °C climate target5,6. However, as this target is in peril4, proposals have emerged to help mitigate devastating climate impacts by conducting deliberate marine cloud brightening (MCB) to ‘buy some time’7,8 while the global economy is decarbonizing. At real-life regional scales, scientists are experimenting with MCB, aimed at saving the Great Barrier Reef from the seawater warming9. However, the efficacy and potential side effects10 of MCB are not well understood or well evaluated, due to an incomplete understanding of ACI.
The underlying principle of MCB is the ACI cooling effect, and the goal is to enhance the planetary albedo by seeding marine clouds with aerosols. The cooling effect of ACI originates from aerosols serving as cloud condensation nuclei, the seeds of cloud droplets. Higher aerosol loadings typically lead to more but smaller cloud droplets, resulting in enhanced cloud albedo and thus more sunlight reflection (Twomey effect)11. Smaller cloud droplets could delay precipitation onset, leading to a longer cloud lifetime and hence larger cloud cover and water content (lifetime effect)12. On the other hand, more but smaller cloud droplets could also enhance entrainment evaporation from dry free troposphere air, possibly leading to a decrease of cloud coverage and albedo (entrainment effect)13. The ACI climate impact is determined by the net effect of the above processes, which are poorly constrained or represented in global climate models (GCMs)1,10,14 resulting in large uncertainties in the magnitude and even the sign of the efficacy when evaluating MCB using multi-model ensembles10.
One reason for the slow progress in the development of realistic simulations of ACI in GCMs is the lack of observational constraints4,6. Satellite observations of aerosol and clouds have been widely employed to study ACI using either small-scale natural experiments or large-scale climatological approaches. Whereas both are useful, they do not provide sufficient constraints6,14,15. Small-scale natural experiments, such as ship tracks and industrial plumes manifested as linear features of brighter clouds, are one prominent pathway to study ACI because confounding meteorological co-variability can generally be ruled out, for example, refs. 5,16, but ship tracks are subgrid scale compared with GCM resolutions. Large-scale climatological studies, for example, refs. 17,18, investigating spatio-temporal co-variability between aerosol and clouds, while more suitable for constraining large-scale GCMs19, are often contaminated by meteorological co-variability6,14. Despite these respective limitations, aggregating a large observational ensemble of small-scale and large-scale satellite observations has resulted in convergence of ACI’s impacts on cloud microphysical properties5,18: a larger cloud droplet number concentration (Nd) reduces cloud droplet effective radius (reff) and brightens clouds with negligible change in the ensemble-averaged cloud liquid water path (LWP). However, ACI’s impact on cloud macro-physical properties, such as cloud cover, is persistently disputed, with disagreement of several orders of magnitude between observations and models1,6,10,14. This is because the large-scale nature of cloud macro-physical properties suggests that small-scale approaches struggle, for example, ship tracks cannot reveal cloud cover response over hundreds of kilometres scale. On the other hand, traditional climatological large-scale approaches also struggle due to confounding meteorological co-variability6,14,20.
Early global modelling studies suggest that enhancing cloud albedo by doubling Nd could offset the warming from CO2 doubling, but they also highlight the large uncertainty associated with cloud macro-physical properties21. Another modelling study estimated that degassing volcanoes increase tropical low-level cloudsʼ Nd by 16% in the present day, leading to a radiative effect (and associated cooling) of about −0.9 W m−2 in the tropics due to the Twomey effect22. However, the Twomey effect could only explain 20% of the increased reflection of sunlight observed by satellites for a degassing volcanic event from Hawaii23. Previous studies23,24,25 suggest that cloud cover adjustment should play a crucial role in ACI cooling and hence MCB, but GCMs struggle to reproduce the observed strong relationship between aerosol and cloud cover14,17,26. MCB could be significantly more effective if cloud cover were to increase strongly in response to aerosol injections10,27, providing further motivation for this study.
Large-scale degassing volcanic eruptions offer ideal natural experiments to investigate the overall impacts of ACI on climate6,18,28 with implications for MCB. Our recent study developed a novel machine-learning approach to quantitatively disentangle aerosol fingerprints on clouds from the noise of meteorological co-variability and demonstrated its fidelity using a high-latitude degassing volcano in Iceland6. Building on this approach, we disentangle the aerosol fingerprints on tropical marine shallow convective clouds and further quantify volcanic aerosol’s radiative cooling as an analogue to MCB. We use four months of observations of volcanic eruptions in Hawaii (Fig. 1), each month with distinct meteorological conditions. These unique natural experiments in the tropics not only provide invaluable constraints for improving climate models but have practical implications for any potential MCB deployment. Whereas areas of stratocumulus frequently exceed 80% cloud cover29, the cloud fraction in areas of tropical oceanic shallow convective clouds are frequently much less than 50%. Thus, any MCB-induced change in the cloud fraction in shallow convective areas could have a disproportionally large cooling impact.
While effective, MCB can only be seen as a ‘pain killer’, because it does not address the cause of warming from anthropogenic greenhouse gases. Our results illustrate the high potential risk of unforeseen large ‘side effects’ of MCB, owing to the large uncertainty due to a poor understanding of aerosol–cloud interactions. This new finding of a large-scale strong cloud cover response taking place in different climate and cloud regimes, as demonstrated by the high-latitude Holuhraun6 and tropical Kilauea eruption natural experiments, is, however, not replicated by state-of-the-art GCMs1,6,10,14,39. It is paramount that we close current gaps in ACI knowledge in a fundamental way not only to advance our understanding of Earth climate system and its hydrological cycle but also for a holistic evaluation of the benefits and risks of MCB.
This study sheds additional light on the understanding of aerosol fingerprints on clouds, especially with regard to cloud cover response. This is critical for more reliable climate projections and underscores the urgent need to have a sound theoretical foundation and a holistic assessment of any potential risks before implementing global warming mitigation strategies, such as MCB.
May 11, 2024 — The Crisis Report — 37
You REALLY need to think about CLOUDS. Clouds in the present-day climate system cover approximately two-thirds of the…smokingtyger.medium.com
notes:
I look at the 2019 papers on clouds and conclude that we may have already crossed the cloud “tipping point”.
May 14, 2024 — Clouds and climate — Nature Geoscience
Nature Geoscience — Cloud uncertainties have been a persistent problem in climate science, but innovative approaches…www.nature.com
notes:
As the climate warms in response to rising greenhouse gases, various aspects of the climate system respond and induce radiative feedbacks that can either amplify or dampen the overall temperature response. The cloud feedback is the least well constrained1, with substantial uncertainties persisting despite considerable efforts. The difficulty arises from the complexity of the processes that govern cloud formation, which span from the microphysical scale to global-scale circulation. Accurate representation of clouds in climate models is challenging, with most global models lacking sufficient resolution to explicitly resolve convection — a process fundamental to the formation of many clouds. In addition, distinct physical processes are responsible for different types of cloud. Therefore, the total cloud feedback comprises many different cloud feedbacks, each requiring quantification.
Constraining future warming is also hampered by large uncertainties in the interactions between clouds and atmospheric aerosols3, which act as cloud condensation nuclei. These interactions make it hard to precisely pin down the magnitude of aerosol-induced radiative forcing over the historical period3. In their Article, Chen et al. tackle this problem by using a machine learning method to distinguish between volcanic aerosol effects and meteorological variability from observations of volcanic eruptions in Hawaii. They observe a strong enhancement of reflected sunlight in response to the aerosol emissions, mainly due to increased cloud cover. This suggests that total historical radiative forcing may be smaller than previously estimated, because aerosols have offset a larger portion of the radiative forcing by greenhouse gases. This provides a further indication that the sensitivity of surface temperature to radiative forcing is higher than previously thought.
Jun. 07, 2024 — How do clouds affect the Earth’s temperature? Are humans changing clouds?
Clouds generally help cool the Earth. In recent decades, human pollution has created more clouds, which slightly…climate.mit.edu
notes:
Today, the number and nature of clouds are changing due to human actions. All types of clouds are composed of particles, which create the scaffolding that ice or water droplets latch on to. “If we didn’t have particles in the atmosphere, it would be much, much more difficult to form clouds,” says Cziczo.
Because humans are emitting particulate matter from agriculture, power plants, and other polluting facilities, there are many more particles in the atmosphere than there were 200 years ago. Climate change itself even contributes: warmer temperatures have created the conditions for worse wildfires, for example, which then put even more particles in the air in the form of smoke.
Just how many particles have we added to the atmosphere? “Estimates are all over the place, but probably a doubling, maybe a tripling of particles, since pre-industrial times,” says Cziczo.
“That’s actually a very uncertain aspect of climate,” says Cziczo. “How much is that cooling? How much global warming is being offset by changes in particles and clouds?”
Diurnally asymmetric cloud cover trends amplify greenhouse warming…..Jun. 19, 2024 Science Advances
notes:
Surface air temperature (SAT) is a key indicator of climate change. Variations in cloud cover affect SAT by interacting with radiation. During daytime, clouds tend to cool the surface by blocking sunlight, while nighttime clouds warm the surface by trapping longwave radiation. Here, we show that, on the global scale, cloud cover, particularly low-level cloudiness, exhibits diurnally asymmetric trends in a warming climate. Cloud fraction on average decreases more during the day than at night. Climate models indicate that the diurnally asymmetric cloud cover variation is mainly driven by trends in the lower tropospheric stability and is largely attributed to the increasing greenhouse gases rather than natural variability. This asymmetry, therefore, turns out to be an amplifier of surface warming, by both decreasing the daytime cloud shortwave albedo effect and increasing the nighttime cloud longwave greenhouse effect.
Jun. 20, 2024 — How shifting cloud patterns are exacerbating climate change
In a warming climate, cloud patterns are changing in ways that amplify global warming. A team of researchers led by…phys.org
notes:
In their study, the scientists used satellite observations and data from the sixth phase of the Coupled Model Intercomparison Project (CMIP6), which provides comprehensive climate models and scenarios. These models cover historical data from 1970 to 2014 and projections up to the year 2100.
“As cloud cover decreases more during the day than at night on a global scale, this leads to a decrease in the short-wave albedo effect during the day and an increase in the long-wave greenhouse effect at night,” explains Hao Luo, lead author of the study.
This daily asymmetry in cloud cover can be attributed to various factors. One major cause is the increasing stability in the lower troposphere as a result of rising greenhouse gas concentrations. This stability means that clouds are less likely to form during the day, while they remain stable or even increase at night.
Yong Han, co-author of the study, explains, “The change in cloud cover is not evenly distributed throughout the day. By day, when solar irradiance is strongest, we observed a greater reduction in clouds. At night, when the Earth’s surface normally cools down, cloud cover retains the heat and thus amplifies the greenhouse effect.”
Sep. 02, 2024 — We’re finally solving the puzzle of how clouds will affect our climate
Clouds can trap heat or reflect it away from Earth, making their impact on global warming extraordinarily hard to…www.newscientist.com
notes:
What casual cloud watchers may not know is that determining how this balance will change in a warming world makes clouds the biggest unknown in predicting future climate change. Will the world warm by a manageable 1.5°C or a hellish 4.5°C, given a doubling of carbon dioxide from pre-industrial levels? Our poor grasp of clouds is the biggest culprit regarding this uncertainty.
recalls rewatching Carl Sagan address the US Congress in 1985 to explain the basic science of climate change. At one point he mentioned uncertainties about future warming due to clouds. She is struck that not much has changed. “It’s really the same fundamental scientific understanding he was expressing 40 years ago,” she says.
We do know the features of clouds that matter most for Earth’s energy balance. Top of the list are their total area, altitude and optical depth, which is a measure of how much light they block. For instance, low, bright clouds have a strong cooling effect because they reflect lots of sunlight without trapping much of the thermal radiation, or warmth, rising from Earth’s surface. Conversely, high clouds like wispy cirrus can have a warming effect because they trap heat below them without reflecting much sunlight back into space.
The cloud forecast
Ongoing global warming will change clouds and those changes will, in turn, influence how much the planet heats up. These are known as cloud feedbacks. They come in many different forms, but three in particular are expected to increase warming.
Loss of clouds at sea
Marine boundary-layer clouds — low-level formations found over much of the ocean — can cover more than a third of Earth’s surface at once and have a substantial cooling effect by reflecting sunlight. However, warmer temperatures will lead to drier air above the ocean, which is expected to reduce the area covered by these clouds, resulting in the most significant of the warming cloud feedbacks.
High clouds get higher
Clouds rise when they are warmer than the surrounding atmosphere, and hence less dense than it. In a warmer world, the altitude at which they stop rising tends to increase. This is a problem because higher clouds have a stronger warming effect. Overall, this is expected to result in a moderate increase in warming.
Fewer clouds over land
Hotter temperatures on land mean less water vapour in the air. This leads to fewer clouds at all levels, but especially those at low altitudes, which reflect lots of sunlight back into space. This feedback is expected to have a small warming effect.
The other major source of uncertainty alongside these cloud feedbacks is the role of particles suspended in the atmosphere called aerosols. From dust and the soot emitted by power plants to floating fungi, aerosols serve as seeds on which water droplets or ice crystals can form and create a cloud. “Clouds have a very, very difficult time forming in the absence of these particles,” says Feingold. The size, type and number of particles affect the brightness of clouds by changing the number of droplets or crystals in them.
Even seemingly small details can have outsized significance. The current focus of Lamb’s research, for instance, is how ice crystals grow in high-flying cirrus clouds. Crystal size matters. “It is one of the most important, sensitive factors in the model,” says Lamb, who has been called the “ice-cloud puzzle master” for her work. Depending on how ice crystals in cirrus clouds are modelled, the predictions show a huge range of warming equivalent to doubling the amount of CO2 in the atmosphere, she says. Yet there is no clear understanding of how aerosols and other factors affect the formation of this ice high in the sky. (Unfortunately, Lamb and I didn’t see any cirrus during our walk in the park; the upper atmosphere was obscured by clouds.)
Understanding aerosols
Current climate models can represent how aerosols affect the brightness of clouds fairly well, but the models don’t do a great job of capturing the particles’ knock-on effects, such as changes to the lifetime of a cloud, says Duncan Watson-Parris at the University of California, San Diego. Better understanding becomes particularly important as we reduce air pollution from burning dirty fuels, which decreases the aerosols in the atmosphere. Since 2020, for example, shipping has been forced to clean up its act. Yet estimates of how much warming this will cause vary widely. This is concerning given the current geoengineering debates about spraying aerosols into the sky to reduce warming, says Watson-Parris. “If we can’t even measure the effect of reducing the emissions of the entire globe’s shipping fleet by 80 per cent four years on, what hope do we have of managing an intervention?”
Improvements to climate models will also come from better observations of real clouds. One important source of this is a satellite launched in May called the Earth Cloud, Aerosol and Radiation Explorer (EarthCARE). A joint mission of the European Space Agency and the Japanese Aerospace Exploration Agency, it is designed to answer questions about the sun-reflecting and heat-trapping effects of clouds and aerosols. It will provide the highest-resolution view of this yet, says Richard Forbes at the European Centre for Medium Range Weather Forecasting.
Sep. 12, 2024 — Is the climate crisis to blame for the lack of clouds?
Scientists have found a surprising explanation for unusually sudden global temperature rises: disappearing clouds…..www.euronews.com
notes:
The climate crisis is consistently setting terrifying new records — 2024 is set to be the hottest year yet and the first to have an average temperature of more than 1.5°C above pre-industrial levels.
Sea levels, glacier melt and heatwaves at sea have all hit their highest levels ever recently, caused by a sudden rise in global temperatures. But scientists have been struggling to explain why temperatures have shot up at such speed.
Calculating the effects of greenhouse gases, weather phenomena and natural events such as volcanic eruptions still leaves an unexplained gap of around 0.2°C.
But a team of researchers from Germany’s Alfred Wegener Institute Helmholtz Centre for Polar and Marine Research (AWI) believes they have identified another cause for the sudden rise in global temperatures: the Earth has become less able to reflect the sun’s rays –because certain types of clouds are disappearing.
Several causes of global warming are already accounted for: El Niño and the expected long-term warming from anthropogenic greenhouse gases with increased solar activity, large amounts of water vapour from a volcanic eruption and fewer aerosol particles in the atmosphere.
But there is still 0.2°C warming with no readily apparent cause, lead author of the study, Dr Helge Goessling, explains.
“The 0.2°C ‘explanation gap’ for 2023 is currently one of the most intensely discussed questions in climate research,” says Dr Goessling.
When climate modellers from the AWI and the European Centre for Medium-Range Weather Forecasts (ECMWF) examined their data, which goes back to the 1940s, alongside NASA’s statistics, they noticed something unusual.
“2023 stood out as the year with the lowest planetary albedo,” says study co-author Dr Thomas Rackow of the ECMWF.
‘Planetary albedo’ is science speak for the percentage of the sun’s rays that get reflected back into space. Low planetary albedo worsens global warming and could explain the ‘missing’ 0.2°C.
“The decline in surface albedo in the polar regions only accounts for roughly 15 per cent of the most recent decline in planetary albedo,” he says. What’s more, the albedo has declined outside of the polar regions, too.
When the researchers calculated the effects of lowered albedo using complex climate models, they found that without reduced albedo, the mean temperature last year would have been around 0.23°C lower.
So, what is causing this significant effect on the planetary albedo? The AWI research team has identified one cause: a decline in low-altitude clouds in the northern mid-latitudes and the tropics.
There’s a marked decline in lower-altitude clouds over the Atlantic Ocean
The Atlantic stands out as one of the regions where the most unusual temperature records were set in 2023 — and it’s here that certain clouds are disappearing.
“It’s conspicuous that the eastern North Atlantic, which is one of the main drivers of the latest jump in global mean temperature, was characterised by a substantial decline in low-altitude clouds not just in 2023, but also — like almost all of the Atlantic — in the past ten years,” says Dr Goessling.
The NASA/ECMWF data examined by researchers shows that the cloud cover at low altitudes has declined — but that cloud cover has barely declined at moderate and high altitudes.
If there are fewer low clouds, we only lose the cooling effect, making things warmer.
Dr Helge Goessling — Clouds study lead author
But why are there fewer low clouds in the sky?
One explanation for the decline in low-altitude clouds is that there are lower concentrations of anthropogenic aerosols in the atmosphere, which could be due to recent stricter regulations around marine fuel. Aerosols play an essential part in cloud formation and contribute to the albedo by reflecting sunlight.
Natural fluctuations and ocean feedbacks could also affect changes in cloud formation. Yet Dr Goessling suggests that global warming itself is reducing the number of low clouds.
“If a large part of the decline in albedo is indeed due to feedbacks between global warming and low clouds, as some climate models indicate, we should expect rather intense warming in the future,” he warns.
Michael Allen on how essential it is to understand how clouds respond to climate…..physicsworld.com
notes:
For all of us concerned about climate change, 2023 was a grim year. According to the World Meteorological Organisation (WMO), it was the warmest year documented so far, with records broken — and in some cases smashed — for ocean heat, sea-level rise, Antarctic sea-ice loss and glacier retreat.
The heatwaves, floods, droughts and wildfires of 2023 are clear signs of the increasing dangers of the climate crisis. As we look to the future and wonder how much the world will warm, accurate climate models are vital.
For the physicists who build and run these models, one major challenge is figuring out how clouds are changing as the world warms, and how those changes will impact the climate system. According to the Intergovernmental Panel on Climate Change (IPCC), these feedbacks create the biggest uncertainties in predicting future climate change.
Clouds play a key role in the climate system, as they have a profound impact on the Earth’s radiation budget. That is the balance between the amount of energy coming in from solar radiation, and the amount of energy going back out to space, which is both the reflected (shortwave) and thermal (longwave) energy radiated from the Earth.
According to NASA, about 29% of solar energy that hits Earth’s atmosphere is reflected back into space, primarily by clouds (figure 1)
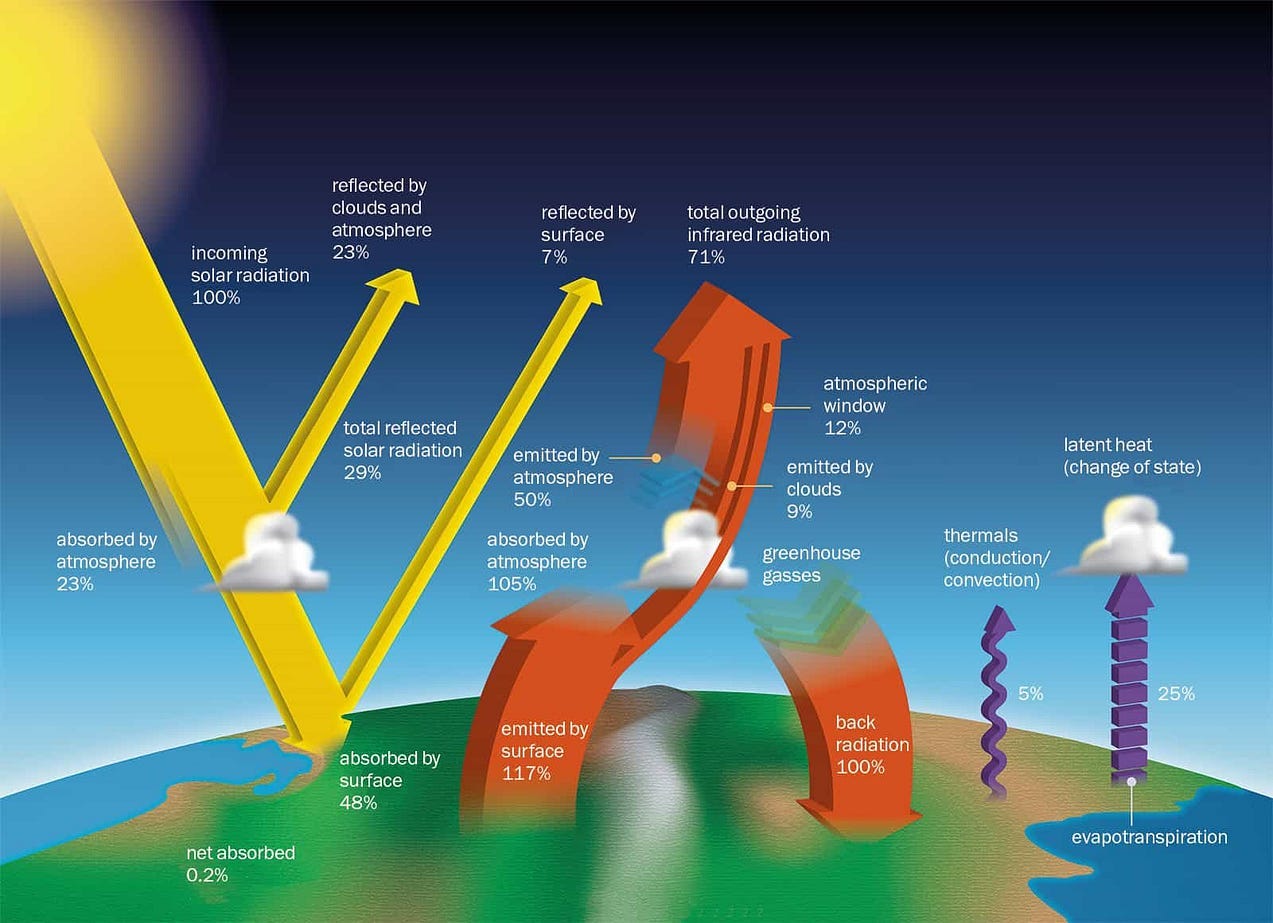
Higher, cooler clouds absorb more thermal energy originating from the Earth’s surface, and therefore have a greater greenhouse warming effect than low clouds. They also tend to be thinner, so they let more sunlight through and overall have a net warming effect. Low clouds, on the other hand, have a weak greenhouse effect, but tend to be thicker and reflect more solar radiation. They generally have a net cooling effect.
The most understood effect, Ceppi explains, is that as global temperatures increase, clouds rise higher into the troposphere, which is the lowermost atmospheric layer. This is because as the troposphere warms it expands, increasing to greater altitudes. Over the last 40 years the top of the troposphere, known as the tropopause, has risen by about 50 metres per decade (Sci. Adv. 10.1126/sciadv.abi8065).
“You are left with clouds that rise higher up on average, so have a greater greenhouse warming effect,” Ceppi says. He adds that modelling data and satellite observations support the idea that cloud tops are rising.
Conversely, coverage of low clouds, which reflect sunlight and cool the Earth’s surface, is decreasing with warming. This reduction is mainly in marine low clouds over tropical and subtropical regions. “We are talking a few per cent, so not something that you would necessarily notice with your bare eyes, but it’s enough to have an effect of amplifying global warming,” he adds.
These changes in low clouds are partly responsible for some of the extreme ocean heatwaves seen in recent years (figure 3). While the mechanisms behind these events are complex, one known driver is this reduction in low cloud cover, which allows more solar radiation to hit the ocean (Science 325 460).
“It’s cloud feedback on a more local scale,” Ceppi says. “So, the ocean surface warms locally and that prompts low cloud dissipation, which leads to more solar radiation being absorbed at the surface, which prompts further warming and therefore amplifies and sustains those events.”
Climate models are affected by more than just the distribution of clouds in space. What also matters is the distribution of liquid water and ice within clouds. In fact, researchers have found that the way in which models simulate this effect influences their predictions of warming in response to greenhouse gas emissions.
So-called “mixed-phase” clouds are those that contain water vapour, ice particles and supercooled liquid droplets, and exist in a three-phase colloidal system. Such clouds are ubiquitous in the troposphere. These clouds are found at all latitudes from the polar regions to the tropics and they play an important role in the climate system.
As the atmosphere warms, mixed-phase clouds tend to shift from ice to liquid water. This transition makes these clouds more reflective, enhancing their cooling effect on the Earth’s surface — a negative feedback that dampens global warming.
In 2016 Trude Storelvmo, an atmospheric scientist at the University of Oslo in Norway, and her colleagues made an important discovery: many climate models overestimate this negative feedback (Geophys. Res. Lett. 10.1029/2023GL105053). Indeed, the models often simulate clouds with too much ice and not enough liquid water. This error exaggerates the cooling effect from the phase transition. Essentially, the clouds in these simulations have too much ice to lose, causing the models to overestimate the increase in their reflectiveness as they warm.
Storelvmo’s work also found that initially, increased cloud reflectivity has a strong effect that helps mitigate global warming. But as the atmosphere continues to warm, the increase in reflectiveness slows. This shift is intuitive: as the clouds become more liquid, they have less ice to lose. At some point they become predominantly liquid, eliminating the phase transition. The clouds cannot become anymore liquid — and thus reflective — and warming accelerates.
Earlier this year, Storelvmo and colleagues carried out a new study, using satellite data to study the vertical composition of mixed-phase clouds. The team discovered that globally, these clouds are more liquid at the top (Commun. Earth Environ. 5 390).
Storelvmo explains that this top cloud layer is important as “it is the first part of the cloud that radiation interacts with”. When the researchers adjusted climate models to correctly capture this vertical composition, it had a significant impact, triggering an additional degree of warming in a “high-carbon emissions” scenario by the end of this century, compared with current climate projections.
“It is not inconceivable that we will reach temperatures where most of [the negative feedback from clouds] is lost, with current CO2 emissions,” says Storelvmo. The point at which this happens is unclear, but is something that scientists are actively working on.
The study also revealed that while changes to mixed-phased clouds in the northern mid-to-high latitudes mainly influence the climate in the northern hemisphere, changes to clouds in the same southern latitudes have global implications.
“When we modify clouds in the southern extratropic that’s communicated all the way to the Arctic — it’s actually influencing warming in the arctic,” says Storelvmo. The reasons for this are not fully understood, but Storelvmo says other studies have seen this effect too.
“It’s an open and active area of research, but it seems that the atmospheric circulation helps pass on perturbations from the Southern Ocean much more efficiently than northern perturbations,” she explains.
The recent “State of Global Air Report 2024” from the Health Effects Institute found that globally eight million people died because of air pollution in 2021. Dirty air is also now the second-leading cause of death in children under five, after malnutrition.
To tackle these health implications, many countries and organizations have introduced air-quality clean-up policies. But cleaning up air pollution has an unfortunate side-effect: it exacerbates the climate crisis. Indeed, a recent study has even warned that aggressive aerosol mitigation policies will hinder our chances of keeping global warming below 2 °C (Earth’s Future 10.1029/2023EF004233).
Jim Haywood, an atmospheric scientist at the University of Exeter, says that aerosols have two major cooling impacts on climate. The first is through the direct scattering of sunlight back out to space. The second is via the changes they induce in clouds.
When you add small pollution particles to clouds, explains Haywood, it creates “clouds that are made up of a larger number of small cloud droplets and those clouds are more reflective”. The shrinking in cloud droplet size can also reduce precipitation — adding more liquid water in clouds. The clouds therefore last longer, cover a greater area and become more reflective.
But if atmospheric aerosol concentrations are reduced, so too are these reflective, planet-cooling effects. “This masking effect by the aerosols is taken out and we unveil more and more of the full greenhouse warming,” says Quaas.
A good example of this is recent policy aimed at cleaning up shipping fuels by lowering sulphur concentrations. At the start of 2020 the International Maritime Organisation introduced regulations that slashed the limit on sulphur content in fuels from 3.5% to 0.5%.
Haywood explains that this has reduced the additional reflectivity that this pollution created in clouds and caused a sharp increase in global warming rates. “We’ve done some simulations with climate models, and they seem to be suggestive of at least three to four years acceleration of global warming,” he adds.
Overall models suggest that if we remove all the world’s polluting aerosols, we can expect to see around 0.4 °C of additional warming, says Quaas. He acknowledges that we must improve air quality “because we cannot just accept people dying and ecosystems deteriorating”. By doing so, we must also be prepared for this additional warming. But more work is needed, “because the current uncertainty is too large”, he continues. Uncertainty in the figures is around 50%, according to Quaas, which means that slashing aerosol pollution could cause anywhere from 0.2 to 0.6 °C of additional warming.
The fact that aerosols cool the planet by brightening clouds opens an obvious question: could we use aerosols to deliberately manipulate cloud properties to mitigate climate change?
“There are more recent proposals to combat the impacts, or the worst of the impacts of global warming, through either stratospheric aerosol injection or marine cloud brightening, but they are really in their infancy and need to be understood an awful lot better before any kind of deployment can even be considered,” says Haywood. “You need to know not just how the aerosols might interact with clouds, but also how the cloud then interacts with the climate system and the [atmospheric] teleconnections that changing cloud properties can induce.”
Haywood recently co-authored a position paper, together with a group of atmospheric scientists in the US and Europe, arguing that a programme of physical science research is needed to evaluate the viability and risks of marine cloud brightening (Sci. Adv. 10 eadi8594).
A proposed form of solar radiation management, known as marine cloud brightening, would involve injecting aerosol particles into low-level, liquid marine clouds — mainly those covering large areas of subtropical oceans — to increase their reflectiveness (figure 4).
Most marine cloud-brightening proposals suggest using saltwater spray as the aerosol. In theory, when sprayed into the air the saltwater would evaporate to produce fine haze particles, which would then be transported by air currents into cloud. Once in the clouds, these particles would increase the number of cloud droplets, and so increase cloud brightness.
Marine cloud brightening
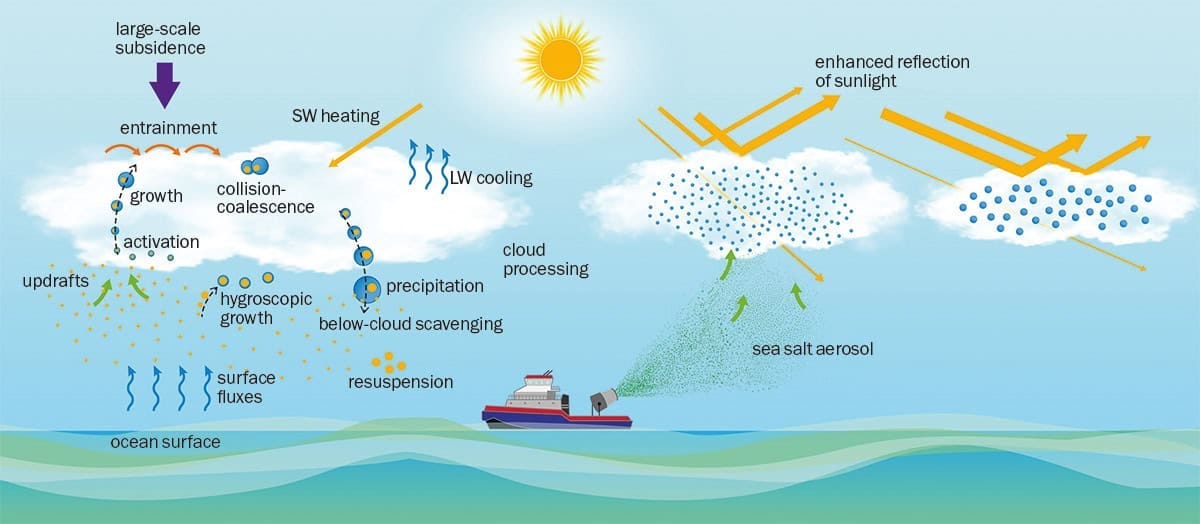
In this proposal, ship-based generators would ingest seawater and produce fine aerosol haze droplets with an equivalent dry diameter of approximately 50 nm. In optimal conditions, many of these haze droplets would be lofted into the cloud by updrafts, where they would modify cloud microphysics processes, such as increasing droplet number concentrations, suppressing rain formation, and extending the coverage and lifetime of the clouds. At the cloud scale, the degree of cloud brightening and surface cooling would depend on how effectively the droplet number concentrations can be increased, droplet sizes reduced, and cloud amount and lifetime increased.
In recent years, much progress has been made in determining the impact of clouds, when it comes to regulating our planet’s climate, and their importance in climate modelling. “While major advances in the understanding of cloud processes have increased the level of confidence and decreased the uncertainty range for the cloud feedback by about 50% compared to AR5 [IPCC report], clouds remain the largest contribution to overall uncertainty in climate feedbacks (high confidence),” states the IPCC’s latest Assessment Report (AR6), published in 2021.
Recent global temperature surge intensified by record-low planetary albedo…..Dec. 05, 2024…..https://www.science.org/doi/10.1126/science.adq7280
notes: (pay walled)
Abstract
In 2023, the global mean temperature soared to almost 1.5 kelvin above the preindustrial level, surpassing the previous record by about 0.17 kelvin. Previous best-guess estimates of known drivers, including anthropogenic warming and the El Niño onset, fall short by about 0.2 kelvin in explaining the temperature rise. Using satellite and reanalysis data, we identified a record-low planetary albedo as the primary factor bridging this gap. The decline is apparently caused largely by a reduced low-cloud cover in the northern mid-latitudes and tropics, in continuation of a multiannual trend. Further exploring the low-cloud trend and understanding how much of it is due to internal variability, reduced aerosol concentrations, or a possibly emerging low-cloud feedback will be crucial for assessing the present and expected future warming.
Dec. 05, 2024 — Low-level clouds play surprise role in global warming
A decrease in clouds at low altitudes may help explain 2023’s global temperature surge…..www.astronomy.com
notes:
a study published today in Science, researchers say they have solved a climate enigma — the inexplicable surge in global temperature in 2023, rising faster than climate models predicted.
By analyzing satellite data and weather records, a team of climatologists in Germany have found that the culprit is likely fewer clouds at low altitudes — lower than about 10,000 feet (3,000 meters). Clouds play a crucial role in keeping Earth cool by reflecting sunlight back into space, and clearer skies means that more sunlight reaches Earth.
The dearth of low-level clouds had gone previously unnoticed because studies that relied on satellite imagery had not been able to distinguish low-level clouds from higher clouds.
Worryingly, this trend of clearer low-level skies may be a result of global warming itself, meaning that the Earth may be entering a feedback cycle that could accelerate warming further.
The astonishing warming trend in 2023 was first noted over the North Atlantic, but “the warming turned out to be more widespread,” says Helge Goessling, lead author of the paper and a climate physicist at the Alfred Wegener Institute in Bremerhaven, Germany. His team also noticed high temperature anomalies in the North Pacific and near the equator.
To understand Earth’s changing climate, scientists must understand how much energy is absorbed by Earth, how much is trapped in the atmosphere by greenhouse gases, and how much sunlight is reflected back into space before it reaches the ground. Clouds are key as they reflect roughly 50 percent of the sunlight that reaches them. By contrast, oceans reflect just 5 percent.
But climatologists couldn’t explain all of last year’s anomalous temperature rise. To be precise, 0.2 degree Celsius (0.36 degree Fahrenheit) of warming could not be accounted for even after including factors like the Sun’s peak in activity, polar ice losses, and decreases in fine particles (aerosols) in the atmosphere.
In other words, Earth’s overall reflectivity — what scientists call its albedo — had decreased, and scientists didn’t know why.
“What happened could not be easily explained with El Niño or other contributors,” says Goessling. “That’s where these low cloud decreases came into play.”
Goessling’s team began focusing on low-level clouds and how they were affecting the Earth’s energy budget. In particular, they used NASA satellite imagery to track cloud coverage, and weather records compiled by the European Centre for Medium-Range Weather Forecasts (ECMWF) to track cloud densities at different altitudes.
NASA’s Clouds and the Earth’s Radiant Energy System (CERES) project compiles satellite data over extended time periods to create a balance sheet of Earth’s radiation budget, tracking how much incoming sunlight our planet absorbs versus how much infrared energy it emits back into space. Meanwhile, the ERA5 project at ECMWF compiles and analyzes various data from satellites, weather balloons, and atmospheric instruments on an hourly basis from sea level to an altitude of 50 miles (80 kilometers), and has done so for the period since 1940.
Since CERES only indicates total cloud coverage, ERA5 was needed to determine cloud densities at different atmospheric levels. Using the ERA5 data, Goessling’s team was able to refine their interpretations of satellite imagery, which pointed toward a deficit of lower-level clouds while upper-level clouds held steady.
So what’s causing the lack of low-level clouds? It may be the warming atmosphere itself.
“If you have greenhouse-gas induced warming, many climate models show us that this also has an effect on clouds, and particularly on low-level clouds,” says Goessling.
Goessling says the decrease in low-level clouds could also partly be due to a drop in coal burning and stricter controls on marine shipping exhaust. The fine particles in such pollution act as seeds for forming clouds. The irony is that as we clean up the air, we may also unleash more climate change. Fewer clouds reflecting less sunlight means more warming.
Overall, the work shows that small variations in low-level clouds are more important than most imagined — and Goessling’s team reckons that this may mean the surge of 2023 will not be an isolated event. “If a large part of the decline in albedo is indeed due to feedbacks between global warming and low clouds, as some climate models indicate, we should expect rather intense warming in the future,” he said in a statement.
2023 set a number of alarming new records. The global mean temperature also rose to nearly 1.5 degrees Celsius above…..phys.org
notes:
“What caught our eye was that, in both the NASA and ECMWF datasets, 2023 stood out as the year with the lowest planetary albedo,” says co-author Dr. Thomas Rackow from the ECMWF.
Planetary albedo describes the percentage of incoming solar radiation that is reflected back into space after all interactions with the atmosphere and the surface of the Earth.
“We had already observed a slight decline in recent years. The data indicates that in 2023, the planetary albedo may have been at its lowest since at least 1940.” This would worsen global warming and could explain the “missing” 0.2 degrees Celsius. But what caused this near-record drop in planetary albedo?
What they found: without the reduced albedo since December 2020, the mean temperature in 2023 would have been approximately 0.23 degrees Celsius lower.
One trend appears to have significantly affected the reduced planetary albedo: the decline in low-altitude clouds in the northern mid-latitudes and the tropics. In this regard, the Atlantic particularly stands out, i.e., exactly the same region where the most unusual temperature records were observed in 2023.
“It’s conspicuous that the eastern North Atlantic, which is one of the main drivers of the latest jump in global mean temperature, was characterized by a substantial decline in low-altitude clouds not just in 2023, but also — like almost all of the Atlantic — in the past 10 years.” The data shows that the cloud cover at low altitudes has declined, while declining only slightly, if at all, at moderate and high altitudes.
The fact that mainly low clouds and not higher-altitude clouds are responsible for the reduced albedo has important consequences. Clouds at all altitudes reflect sunlight, producing a cooling effect. But clouds in high, cold atmospheric layers also produce a warming effect because they keep the warmth emitted from the surface in the atmosphere.
A new study links decreasing cloud cover over the ocean to last year’s spiking heat, adding to research showing Earth’s…..insideclimatenews.org
notes:
the planet has lost some of its sheen in recent decades, especially with the well-documented decline of ice and snow in polar and mountain regions. New research published today shows the planet is also dulling from a steady decline of low-elevation clouds over some ocean regions.
And a duller planet absorbs more incoming solar radiation, said Helge Gössling, a climate researcher at the Alfred Wegener Center and lead author of the Science paper linking the overall decline of the planet’s reflectivity in 2023 with a simultaneous surge of the global average temperature.
The findings, Gössling said, suggest that the sharp drop of low-elevation cloud cover over some ocean regions could account for most of the sudden spike of global temperatures in 2023, when the Earth’s fever jumped 0.17 degrees Celsius (0.3 degrees Fahrenheit) above the previous temperature record set in 2016.
Several factors are driving the decline of the Earth-cooling low marine cloud layers, he said, including climate cycles like El Niño, as well as a drop of sulfate aerosol emissions from shipping and other industrial sources. But he said he was most worried that the study affirms other research showing that global warming itself is driving the loss of clouds by diffusing distinct layers of the atmosphere that promote the formation and persistence of low-elevation marine clouds.
If the drop in the proportion of solar radiation being reflected back to space — called albedo — is due to feedbacks between global warming and low clouds, “we should expect rather intense warming in the future,” Gössling said. “We could see global long-term climate warming exceeding 1.5 degrees Celsius sooner than expected.”
Up to now, climate models have been highly uncertain about the feedback between warming temperatures and changes in cloud cover, said Zeke Hausfather, a climate researcher with Berkeley Earth who was not involved in the new study.
He said the paper provides a useful assessment of measured changes in cloud cover, but still “raises as many questions as it provides answers.”
“We still do not know for sure that these changes in cloud behavior are not due to short-term variability,” Hausfather said, “or if they represent a new ongoing change to the climate system.”
If the cloud cover decline measured in the new study represents an ongoing change, “it remains difficult to disentangle how much might be due to changing human aerosol emissions versus a feedback from human greenhouse gas emissions. But in either of those cases, it is not good news,” he said, because it would suggest that the climate is more sensitive to greenhouse gases than widely thought.
The research led by Gössling is not the first warning about accelerated warming, and it’s not the first to suggest strong links between reductions of shipping emissions and regional global warming hotspots. A study published last May in the Proceedings of the National Academy of Sciences described how a reduction of industrial aerosol emissions in China worsened ocean heat waves in the Pacific.
Another study published in Earth System Dynamics last week specifically modeled how changes to rules on shipping emissions in 2020 help explain the anomalous 2023 warming, concluding that the significant reductions in sulfate aerosol emissions from ships “have been a major contributing factor to the monthly surface temperature anomalies during the last year.”
When famed climate scientist James Hansen warned of that effect in 2021 and projected a steep acceleration of warming, his findings were criticized by some other scientists as over-emphasizing the role of sulfate aerosols. But aerosol-focused research since then, as well as continued warming into 2024, seems to support his conclusions.
In any case, the big temperature jump that began in 2023 and continued through much of 2024 still can’t be fully explained, even with the new study, said Gavin Schmidt, director of NASA’s Goddard Institute for Space Studies. In a November editorial in The New York Times, Schmidt and Hausfather wrote that the recent warming “appears to be higher than our models predicted (even as they generally remain within the expected range).” The continued lack of a consensus explanation for the spike is making scientists uneasy, they wrote, because the implications of faster warming include more deadly climate extremes.
Schmidt said the new study helps explain, and fills in some of the knowledge gaps, about the recent warming by linking it with Earth’s dwindling reflectivity.
“But we still aren’t able to say why the albedo has been changing so much,” he said. “Is it aerosols, cloud feedbacks or volcanoes? So there is still more to do before we can say what this means going forward.”
Gössling said the “explanation gap” for 2023 remains “one of the most intensely discussed questions in climate research.”
Dec. 05, 2024 — Disappearing clouds could have contributed to hottest year on record
Last year eclipsed predicted temperatures. Now a new study suggests the extra warming occurred when the Earth became…..www.abc.net.au
notes:
The record-breaking heat of 2023, which saw the planet warm an average 1.45 degrees Celsius over pre-industrial surface temperatures, took many climate scientists by surprise.
Their closest predictions, which simulated the effects of human-created warming and other known drivers, were around 0.2C lower than observed temperatures.

To assess how low cloud cover changed in 2023, the new study used data from the European Centre for Medium-Range Weather Forecasts as well as radiation readings from NASA’s Clouds and the Earth’s Radiant Energy System.
The analysis suggested in 2023, there were far fewer low clouds over the northern mid-latitude and tropical oceans, particularly in the Atlantic, and this could account for the 0.2C of warming.
But the reasons for this drop in low cloud cover are unclear.
Dr Goeslling said changes in aerosol use by people may affect low cloud cover. Climate change may also change how low clouds form.
A third reason could be natural regional variability, which are variations in the climate system outside of human influence.
“We are not daring to put numbers on which is contributing how much to do this,” Dr Goeslling said.
“I consider our study just another piece of the puzzle.”
NASA’s Goddard Institute for Space Studies director and climatologist Gavin Schmidt, who was not involved in the study, said the research “goes some way into explaining the process of recent warming.
“But we still aren’t able to say why the albedo has been changing so much, and so there is still more to do before we can say what this means going forward.”
Climate research scientist Zeke Hausfather from the not-for-profit data science group Berkeley Earth, and who was also not involved in the study, thought the study provided a useful assessment of changes in cloud cover.
“Though it raises as many questions as it provides answers,” he said.
“We still do not know for sure that these changes in cloud behaviour are not due to short-term variability — which would return to more normal conditions with time — or if they represent a new ongoing change to the climate system.
“If they do represent an ongoing change, it remains difficult to disentangle how much might be due to changing human aerosol emissions versus a feedback from human greenhouse gas emissions.”
Dr Hausfather said either case was not good news as they both suggested a warmer future.
Contraction of the World’s Storm-cloud Zones the Primary Contributor to the Recent Increase in Cloud Radiative Warming…..Dec. 11, 2024 Presented at AGU24
Abstract
In a recent analysis of multiple satellite datasets, Tselioudis et al. (2024) examined the zonal mean trends of cloud and radiation properties during the satellite era and found a poleward expansion of the subtropical low cloud cover region in both hemispheres along with a narrowing of the tropical ITCZ zone, but also decreasing cloud cover trends within the subtropical cloud regime that result in contrasting cloud cover trends between high and low latitude regions. In this work, first regions of high cloud cover and strong cloud radiative cooling are defined in the tropics and midlatitude zones, representing the ITCZ and the midlatitude storm tracks respectively, and then the trends in the areal coverage of those regions over the past 22 years are examined along with the trends in the SW Cloud Radiative Effects (SWCRE) of the clouds within each region. This allows for the decomposition of the SWCRE trends between changes in the areal coverage of the high and low cloud cover regions and changes in the radiative properties of the clouds in each region. It is found that in the midlatitude zones a strong contraction of the storm-cloud regions produces cloud radiative warming of 0.5W/m2/decade, which is counteracted by an increase in cloud radiative cooling in the low cloud cover region of about 0.2 W/m2/decade resulting in a net midlatitude cloud radiative warming of 0.35 W/m2/decade. In the tropics, the contraction of the ITCZ produces a net cloud radiative warming of 0.3 W/m2/decade, which is aided by an increase in cloud radiative warming in the low cloud cover region of 0.28 W/m2/decade resulting in a tropical cloud radiative warming of 0.56 W/m2/decade. The results indicate that changes in large-scale dynamical processes, primarily midlatitude storm shifts and ITCZ narrowing, produce contraction of the world’s storm-cloud zones and constitute the primary contributor to the recent increase in cloud radiative warming.
Earth’s clouds are shrinking, boosting global warming…..Dec. 19, 2024 Science
Narrowing storm bands may be a surprising and dangerous new feedback of climate change
notes:
For more than 20 years, NASA instruments in space have tracked a growing imbalance in Earth’s solar energy budget, with more energy entering than leaving the planet. Much of that imbalance can be pinned on humanity’s greenhouse gases emissions, which trap heat in the atmosphere. But explaining the rest has been a challenge. The loss of reflective ice, exposing darker ground and water that absorb more heat, isn’t enough to explain the deficit, and the decline in light-reflecting hazes as countries clean up or close polluting industry falls short as well. “Nobody can get a number that’s even close,” says George Tselioudis, a climate scientist at NASA’s Goddard Institute for Space Studies.
But Tselioudis and his colleagues now think they can explain the growing gap with evidence collected by a remarkably long-lived satellite. They find that the world’s reflective cloud cover has shrunk in the past 2 decades by a small but tangible degree, allowing more light in and boosting global warming. “I’m confident it’s a missing piece. It’s the missing piece,” says Tselioudis, who presented the work last week at a meeting of the American Geophysical Union.
Climate scientists now need to figure out what’s causing these cloud changes. They also need to tackle a more alarming question: whether the trend is a feedback of climate change that might accelerate warming into the future, says Michael Byrne, a climate dynamicist at the University of St. Andrews. Although some models have predicted the cloud changes, Byrne says, “I don’t think we can answer this question with much confidence.”
Clouds come in all shapes and sizes, but two of the most consistent cloud swaths are formed by Earth’s large-scale airflow patterns. One band, near the equator, stretches around the planet like a belt. It forms as trade winds of the Northern and Southern hemispheres converge, forcing moist air upward to cool and condense into clouds. Another band occurs in the midlatitudes, where jet streams usher large swirls of stormy weather around the planet.
In August, Tselioudis and his co-authors reported that over the 35 years covered by weather satellite imagery, the equatorial cloud bands had narrowed, while the tracks of midlatitude storms had shifted toward the poles, hemming in the region in which they can form and shrinking their coverage. But the result, published in Climate Dynamics, was stitched together from many different satellites, each with its own quirks and errors, which made it hard for the researchers to be sure the small trends they detected were real.
Now, the team has turned to a single satellite, NASA’s Terra, which has been monitoring the planet for nearly a quarter-century. Looking at the same cloud systems, the team found exactly the same trends, with cloud coverage falling by about 1.5% per decade, Tselioudis says. “It’s only now that the signal seems to be coming out of the noise.” Bjorn Stevens, a climate scientist at the Max Planck Institute for Meteorology, says a couple percentage points may not sound important. “But if you calculate these trends, it’s massive,” he says. “This would indicate a cloud feedback that’s off the charts.”
Earlier this year, in Surveys in Geophysics, a group led by climate scientist Norman Loeb at NASA’s Langley Research Center also traced the gap in the energy imbalance to declining cloud coverage. But Loeb, who leads work on the set of NASA satellite instruments called Clouds and the Earth’s Radiant Energy System, which tracks the energy imbalance, thinks pollution declines may be playing an important role in the cloud changes, especially in the Northern Hemisphere. “The observations are telling us something is definitely changing,” he says. “But it’s a complicated soup of processes.”
2025
Tropical marine low cloud feedback is key to the uncertainty in climate sensitivity, and it depends on the warming…..www.nature.com
notes:
Tropical marine low cloud feedback is key to the uncertainty in climate sensitivity, and it depends on the warming pattern of sea surface temperatures (SSTs).
Here, we empirically constrain this feedback in two major low cloud regions, the tropical Pacific and Atlantic, using interannual variability. Low cloud sensitivities to local SST and to remote SST, represented by lower-troposphere temperature, are poorly captured in many models of the latest global climate model ensemble, especially in the less-studied tropical Atlantic. The Atlantic favors large positive cloud feedback that appears difficult to reconcile with the Pacific — we apply a Pareto optimization approach to elucidate trade-offs between the conflicting observational constraints. Examining ~200,000 possible combinations of model subensembles,
this multi-objective observational constraint narrows the cloud feedback uncertainty among climate models, nearly eliminates the possibility of a negative tropical shortwave cloud feedback in CO2-induced warming, and suggests a 71% increase in the tropical shortwave cloud feedback.
Scientists find cloud feedbacks amplify warming more than previously thought…..Jan. 24, 2025 NOAA/MAPP
notes:
(Another) study published in Nature Communications and funded by the Climate Program Office’s Modeling, Analysis, Predictions, and Projections (MAPP) program adds to the growing evidence that cloud feedback is very likely to amplify warming in the climate system, rather than reduce it.
The study found that the impact of clouds in the tropical Pacific and Atlantic Oceans, two areas where low clouds are especially important, is much stronger than scientists previously thought — 71% higher.
It also ruled out the possibility that tropical low clouds could have a cooling effect to offset warming.
These findings narrow the uncertainty around one of the biggest unknowns in climate science and enable more accurate predictions of how much warming we might expect. This work was possible thanks to new techniques that balanced conflicting data from different regions, giving clearer answers.
The results show that Earth’s climate is likely more sensitive to rising carbon dioxide levels than many models have suggested.
A stronger positive cloud feedback means faster and higher levels of warming. It also highlights the need to improve how climate models represent clouds, especially in tropical areas, to prepare better for the challenges of a changing climate.
In the early 2000s, climate scientists could not say with confidence whether clouds would mitigate or amplify climate change. Some hypothesized that clouds might work to oppose a significant portion of human-caused warming by reflecting more incoming solar energy back out to space, while others hypothesized that particular changes in clouds might magnify warming by trapping more energy in the atmosphere.
In 2001, NOAA’s Geophysical Fluid Dynamics climate model was one of only three that simulated the type of significant positive cloud feedback we now know is likely happening.
Feb. 14, 2025 — Scientists have a new explanation for the last two years of record heat
Rising temperatures are fueled, in part, by declining cloud cover — which could be a potential climate feedback loop.www.washingtonpost.com
For the past few years, scientists have watched, aghast, as global temperatures have surged — with both 2023 and 2024 reaching around 1.5 degrees Celsius above the preindustrial average. In some ways, that record heat was expected: Scientists predicted that El Niño, combined with decreasing air pollution that cools the earth, would cause temperatures to skyrocket.
Earth’s overall energy imbalance — the amount of heat the planet is taking in minus the amount of heat it is releasing — also continues to rise, worrying scientists. The energy imbalance drives global warming. If it rises, scientists expect global temperatures to follow.
Two new studies offer a potential explanation: fewer clouds. And the decline in cloud cover, researchers say, could signal the start of a feedback loop that leads to more warming.
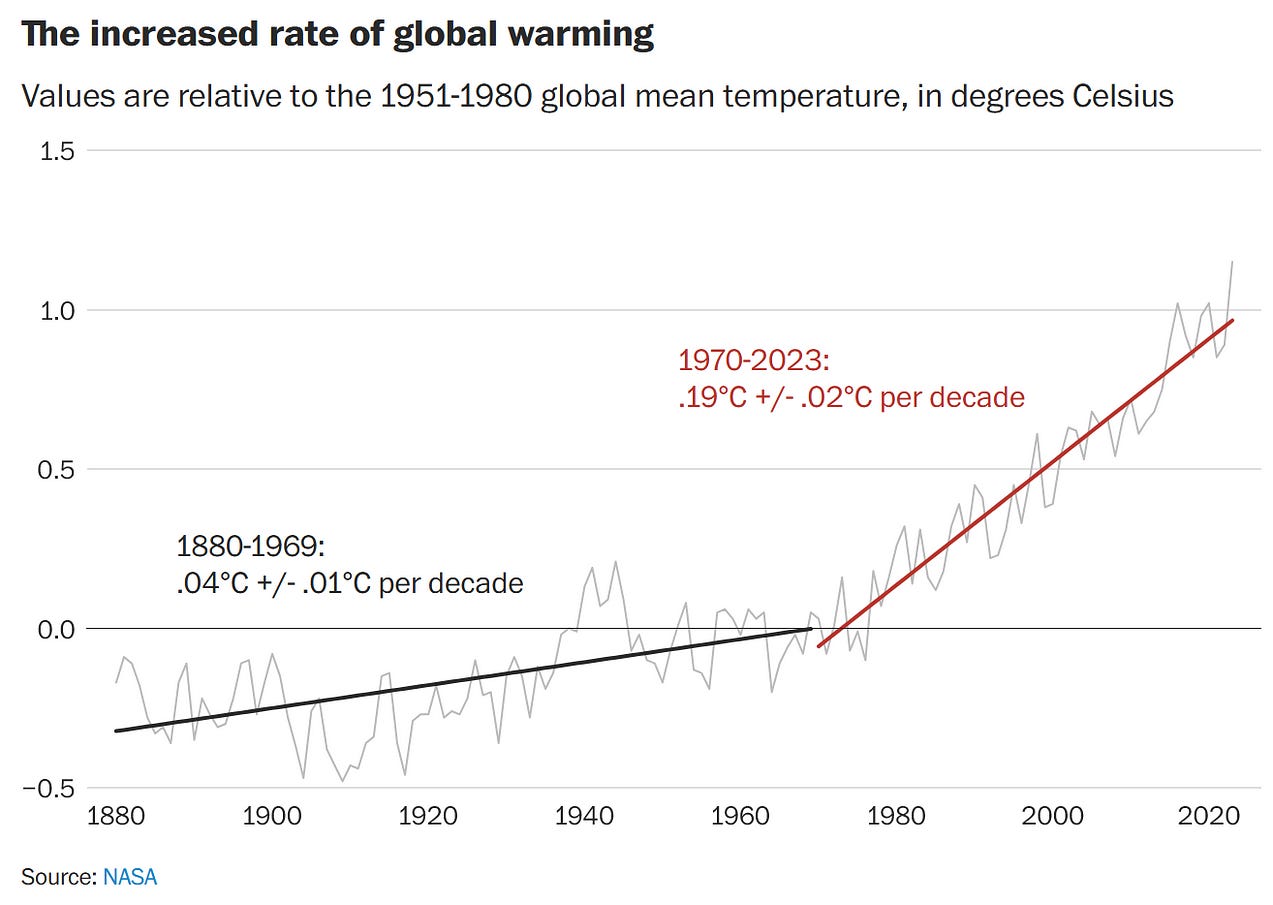
One — Researchers are beginning to pinpoint how clouds are changing as the world warms. In Goessling’s study, published in December in the journal Science, researchers analyzed how clouds have changed over the past decade. They found that low-altitude cloud cover has fallen dramatically — which has also reduced the reflectivity of the planet. The year 2023 — which was 1.48 degrees Celsius above the preindustrial average — had the lowest albedo since 1940.
In short, the Earth is getting darker.
That low albedo, Goessling and his co-authors calculated, contributed 0.2 degrees Celsius of warming to 2023’s record-high temperatures — an amount roughly equivalent to the warming that has so far been unexplained. “This number of about 0.2 degrees fairly well fits this ‘missing warming,’” Goessling said.
Two — Other scientists have also found declining cloud cover. In a preprint study presented at a science conference in December, a group of researchers at NASA found that some of the Earth’s cloudiest zones have been shrinking over the past two decades. Three areas of clouds — one that stretches around the Earth’s equator, and two around the stormy midlatitude zones in the Northern and Southern Hemispheres — have narrowed since 2000, decreasing the reflectivity of the Earth and warming the planet.
warming could be constraining these cloud-heavy regions — thus heating the planet. “We’ve always understood that the cloud feedback is positive — and it very well could be strong,” he said. “This seems to explain a big part of why clouds are changing the way they are.”
If the cloud changes are part of a feedback loop, scientists warn, that could indicate more warming coming, with extreme heat for billions of people around the globe. Every hot year buttresses the idea that some researchers have now embraced, that global temperature rise will reach the high end of what models had predicted. If so, the planet could pass 1.5 degrees Celsius later this decade.
Feb. 19, 2025 — Cloud cover decline may be driving Earth’s record temperatures
You aren’t imagining it: The cloud cover isn’t what it used to be, and scientists say it is helping fuel Earth’s…..phys.org
notes: (reporting on the WAPO article).
Global temperatures clocked in at roughly 1.5 degrees Celsius above pre-industrial averages in both 2023 and 2024.
While climate experts say some of the rise can be explained by a weather pattern called El Niño that causes unusual Pacific Ocean warming along with decreasing air pollution that cools Earth, they agree that those factors alone don’t explain the record heat.
Simply put: Earth is taking in more heat than it’s releasing — an energy imbalance that drives global warming.
Enter a new round of studies that suggest fewer clouds are playing a big role.
Cloud cover matters: Not only do clouds reflect sunlight and cool off Earth, they also reflect infrared radiation back to the Earth’s surface.
Feb. 20, 2025 — Shrinking cloud cover may be driving record global temperatures,
Scientists have been alarmed in recent years as global temperatures continue to rise at an unprecedented rate. Both…..newsbase.com
notes:
Scientists have been alarmed in recent years as global temperatures continue to rise at an unprecedented rate. Both 2023 and 2024 saw temperatures around 1.5°C above pre-industrial levels, a threshold that climate agreements have long sought to avoid. Although factors such as El Niño and reduced air pollution, which previously helped cool the planet, have been expected to contribute to this warming, experts say these alone do not fully explain the record-breaking heat.
Two recent studies suggest a new explanation: a decline in cloud cover. Scientists warn that fewer clouds could be triggering a feedback loop that accelerates global heating, making it even harder to curb rising temperatures.
What’s causing the decline in cloud cover?
Scientists are still working to determine the precise reasons behind the decrease in clouds. One theory is that lower air pollution levels are playing a role. Airborne particles, or aerosols, provide a surface for water droplets to cling to, aiding cloud formation. As air pollution has declined, particularly in regions where emissions controls have improved, fewer particles may be available to help sustain cloud cover.
Another possibility is that rising temperatures themselves are making it harder for some clouds to form. Moist stratocumulus clouds, which typically develop just below a dry atmospheric layer about a mile above the surface, depend upon stable conditions. Warming temperatures may be causing hot air from below to mix with this dry layer, disrupting the environment that these clouds need to persist.
A separate study presented by NASA researchers at a recent scientific conference supports Goessling’s findings. NASA’s research indicates that some of the Earth’s cloudiest regions have been shrinking over the past two decades.
George Tselioudis, a climate scientist at NASA’s Goddard Institute for Space Studies in the US and lead author of the study, found that three key cloud zones have narrowed since 2000: one stretching around the equator and two located in mid-latitude storm belts in both hemispheres. The contraction of these cloud-heavy regions has made the Earth less reflective, contributing to rising temperatures.
Tselioudis and his team estimate that cloud cover in these areas has been shrinking by about 1.5% per decade. “We’ve always understood that the cloud feedback is positive — and it very well could be strong,” Tselioudis told the Post. “This seems to explain a big part of why clouds are changing the way they are.”
The risk of a dangerous feedback loop
Interplay between climate and carbon cycle feedbacks could substantially enhance future warming, Kaufhold, Christine…..iopscience.iop.org
notes: (the paper)
In light of uncertainties regarding climate sensitivity and future anthropogenic greenhouse gas emissions, we explore the plausibility of global warming over the next millennium which is significantly higher than what is usually expected. Although efforts to decarbonize the global economy have significantly shifted global anthropogenic emissions away from the most extreme emission scenarios, intermediate emission scenarios are still plausible. Significant warming in these scenarios cannot be ruled out as uncertainties in equilibrium climate sensitivity (ECS) remain very large. Until now, long-term climate change projections and their uncertainties for such scenarios have not been investigated using Earth system models (ESMs) that account for all major carbon cycle feedbacks.
we performed simulations for the next millennium under extended SSP1–2.6, SSP4–3.4 and SSP2–4.5 scenarios. These scenarios are usually associated with peak global warming levels of 1.5 ∘C, 2 ∘C and 3 ∘C, respectively, for an ECS of ∼3 ∘C, considered the best estimate in the latest Intergovernmental Panel on Climate Change (IPCC) report.
As ECS values lower or higher than this estimate cannot be ruled out, we emulate a wide range of ECS from 2 ∘C to 5 ∘C, defined as the ‘very likely’ range by the IPCC. Our results show that achieving the Paris Agreement goal of a 2 ∘C temperature increase is only feasible for low emission scenarios and if ECS is lower than 3.5 ∘C.
With an ECS of 5 ∘C, peak warming in all considered scenarios more than doubles compared to an ECS of 3 ∘C. Approximately 50% of this additional warming is attributed to positive climate–carbon cycle feedbacks with comparable contributions from CO2 and CH4.
The interplay between potentially high ECS and carbon cycle feedbacks could drastically enhance future warming, demonstrating the importance of properly accounting for all major climate feedbacks and associated uncertainties in projecting future climate change.
Extensive and concerted research efforts have focused on predicting changes in the Earth’s climate over the next century, yet comparatively less effort has been devoted to quantifying the long-term implications of the anthropogenic influence on climate (Forster et al 2021). Although it has been known since the beginning of the 21st century that anthropogenic emissions will have a very long lifetime (Archer and Brovkin 2008, Archer et al 2009b) and can still have repercussions on the timescale of hundreds of thousands of years (Ganopolski et al 2016), it is usually expected that the elevated CO2 concentration will rapidly decrease after the peak and subsequent cessation of anthropogenic emissions, and that global temperature will follow (MacDougall et al 2020).
Steffen et al (2018) recently suggested that even modest anthropogenic emissions could cause the destabilization of the Earth’s climate through a chain of strongly nonlinear positive feedbacks, pushing it towards a much warmer climate state named ‘hothouse’. The possibility that temperature increases from pre-industrial levels could be much higher than usually expected, even in low-to-intermediate emission scenarios, is understudied (Kemp et al 2022).
Although some modelling studies have examined the impact of equilibrium climate sensitivity (ECS; Flynn and Mauritsen 2020, Huusko et al 2021) and climate–carbon cycle feedbacks (Booth et al 2017, Arora et al 2020, Melnikova et al 2021, Asaadi et al 2024) on climate projections, few have focused on systematically examining the climate evolution beyond 2100 CE (Mikolajewicz et al 2007, Solomon et al 2009, Gillett et al 2011). This scarcity is largely due to the high computational costs of Earth system models (ESMs), which have otherwise disregarded or simplified long-term processes (i.e. marine sediment dynamics and chemical rock weathering) that are marginally significant for centennial timescales. Instead, ESMs prioritize short-term processes which are important for the centennial time scales targeted by the IPCC. There are a few notable exceptions, such as permafrost carbon, which are incorporated in only a few ESMs and could crucial for understanding the projected multi-centennial evolution of atmospheric CO2 concentration. As only a few ESMs have the ability to simulate CH4 interactively, the long-term impacts of potentially significant carbon cycle feedbacks from permafrost or wetlands have not been accounted for.
The uncertainties in anthropogenic climate change predictions primarily originate from future emission scenarios and climate sensitivity. The latter is determined by the strength of several climate feedbacks, some of which, especially the cloud feedback, are rather uncertain (Schneider et al 2019, Mann 2021). It is for this reason constraining the Earth’s ECS, defined as the steady-state global-mean surface air temperature change due to a doubling atmospheric CO2, is considered to be of fundamental importance for climate science (Sherwood and Forest 2024). Observational data only provides loose constraints on ECS given the limited time period of instrumental observations that is further complicated by the many uncertainties in anthropogenic radiative forcing (Carslaw et al 2013, Lee et al 2016, Gregory et al 2020). Attempts at constraining the ECS using paleoclimatic data have also been performed (Rohling et al 2012), but this approach has limitations as the most comprehensive data available originates from cold (i.e. glacial) conditions. Since ECS can be strongly climate-dependent (Pfister and Stocker 2017, Bloch-Johnson et al 2021), climate sensitivity derived from colder climates is not necessarily applicable to warmer climates. Understanding how feedback processes operate in warm climatic conditions (Caballero and Huber 2013, Shaffer et al 2016), as well as any emergent constraints on ECS (Caldwell et al 2018), are still in the early stages of investigation.
State-of-the-art ESMs and climate models which participated in the Coupled Model Intercomparison Project Phase 6 (CMIP6) exhibit a large spread in ECS (1.8 ∘C–5.6 ∘C, Forster et al 2021), with ten models reportedly having an ECS larger than 4.5 ∘C (Zelinka et al 2020). This wide range in ECS estimates is primarily attributed to the different strengths of climate feedbacks, with cloud feedbacks exhibiting the largest uncertainty (Zelinka et al 2020). Although the IPCC estimates the ‘very likely’ range of ECS is 2 ∘C–5 ∘C (with a best estimate of 3 ∘C, Forster et al (2021)), values even higher than 5 ∘C cannot be disregarded as impossible at the present time (Knutti et al 2017, Bjordal et al 2020, Rugenstein et al 2020, Sherwood et al 2020, Mann 2021, Wall et al 2022). While there is a tendency for CMIP6 models with high ECS to overestimate the historical warming trend, at least some models with very different ECS can skillfully represent the increase of the global-mean surface temperature over the industrial era (Nijsse et al 2020, Tokarska et al 2020). This can be at least partly explained by the stronger negative aerosol forcing offsetting the impact of high ECS in these models (Meehl et al 2020), as the direct and indirect effects of aerosols on the radiation balance and clouds are very uncertain (Lohmann et al 2010, Myhre et al 2013, Zelinka et al 2013, Wall et al 2022).
Recent studies suggest that the likelihood of ECS to be above 4.5 ∘C (the former upper bound of the IPCC range) is approximately 10%, and 5% for ECS above 5 ∘C (Sherwood et al 2020). While these high ECS values are by no means very likely, they cannot be entirely ruled out, and comprehensive risk management still demands an assessment of even the most extreme cases, regardless of the likelihood (Kemp et al 2022, Davidson and Kemp 2024). Investigating uncertainties related to climate sensitivity, feedbacks in the carbon cycle, and tipping points under more realistic scenarios are, therefore, more pertinent, especially as high emission pathways like SSP3–7.0 and SSP5–8.5 are becoming less aligned with current emission trends (Burgess et al 2020, Hausfather and Peters 2020, Pielke et al 2022, Hausfather 2025)
The high-latitudes consistently show the largest changes in temperature (figure 3). At 2300 CE, warming in the SSP1–2.6 and SSP4–3.4 scenarios is particularly pronounced over areas of the Arctic Ocean with retreating sea ice margins, like that of the Greenland and Barents-Kara seas (figures 3(a) and (b)). Arctic temperatures in SSP1–2.6 exhibit an average increase of approximately 4 ∘C by year 2300, which can reach up to 11 ∘C in some regions (figure 3(a)). In SSP2–4.5, the average temperature in the Arctic nearly doubles compared to SSP1–2.6, with some regions having temperature increases up to ∼15 ∘C by 2300 CE (figures 3(c) and (j)). The increased warming of the high-latitudes is primarily attributed to polar amplification, caused by the reduction of sea ice and snow (surface-albedo feedback) and surface confinement of warming (positive lapse-rate feedback). While summer sea ice area at 2300 CE ranges between 1–2 million km2 in the SSP1–2.6 and SSP4–3.4 scenarios, this value approaches near-zero in SSP2–4.5 (figures S7(a)–©). Winter sea ice also decreases substantially (figures S7(a)–©). Permafrost area decreases between ∼30%–60% compared to the pre-industrial, depending on the emission scenario (figures 3(d)–(f)) and S8(a)–©). The spatial patterns of temperature change at the time of peak global warming closely resemble those at the end of the millennium (figures 3(d)–(f)).
Impact of climate sensitivity on future climate change
Uncertainties in climate sensitivity cause a substantial spread in the simulated temperature change (figures 1(a)–©). A similar uncertainty range is produced by the CMIP6 ensemble, mainly due to the large spread in ECS among CMIP6 models (table S1). In the case when we used the same forcings as in CMIP6, the results for SSP1–2.6 and SSP2–4.5 are in good agreement with CMIP6 models (figures S3(a) and (b)). However, in simulations with the interactive carbon cycle (figures 1(a) and ©), our highest simulated temperature change exceeds the range of CMIP6 models, even though the highest ECS considered in our experiments (5 ∘C) is lower than the maximum ECS in the CMIP6 ensemble (5.6 ∘C). This is related to the positive carbon cycle feedbacks in our model. High ECS values are associated with greater warming and larger CO2 and CH4 concentrations than in the reference run, with the reverse being true for low ECS values. In addition to this, the spread in temperature due to different ECS generally increases with increasing cumulative emissions. Compared to the reference run, low climate sensitivity (ECS = 2 ∘C) results in global temperature anomalies which are approximately 0.5 ∘C, 0.8 ∘C and 1.4 ∘C lower, corresponding to temperature peaks of just 1.2 ∘C, 1.5 ∘C and 2.1 ∘C across the different emission scenarios. On the contrary, a high ECS (ECS = 5 ∘C) can cause additional temperature increases of approximately 1.6 ∘C, 2.3 ∘C and 3.7 ∘C in the SSP1–2.6, SSP4–3.4, and SSP2–4.5 scenarios compared to the reference run, leading to maximum global mean temperature anomalies of around 3.4 ∘C, 4.6 ∘C and 7.2 ∘C; roughly twice the maximum warming produced with ECS = 3 ∘C. Therefore, there is a non-negligible probability that, despite the ambitious decarbonization efforts in SSP1–2.6, Earth can undergo ∼3.5 ∘C warming (figure 1(a)). This possibility increases to 10% for ECS = 4.5 ∘C (Sherwood et al 2020), which anticipates a ∼3 ∘C peak increase in our simulations (figure 1(a)). According to our simulations, achieving the goal of a 1.5 ∘C temperature increase as outlined in the 2015 Paris Agreement (UNFCC 2015) is only feasible for SSP1–2.6 if ECS is lower than the current best estimate of 3 ∘C (Forster et al 2021). This implies that, if ECS is greater than 3 ∘C, carbon reduction and removal must be even faster than the SSP1–2.6 scenario to ‘keep 1.5 ∘C alive’.
Climate sensitivity also has a sizeable effect on temperatures simulated at the end of the millennium, with projected warming at 3000 CE ranging from 0.7 ∘C–1.5 ∘C when ECS = 2 ∘C, to 2.6 ∘C–5.3 ∘C when ECS = 5 ∘C, depending on the scenario. Increasing ECS from the reference 3 ∘C to 5 ∘C results in a significant rise in temperatures worldwide, resulting in larger differences compared to the pre-industrial (figures 3(g)–(i)). Temperature increases in the Arctic more than double when compared to the global mean under all emission scenarios (figure 3(l)).
Atmospheric CO2 concentration in the SSP scenarios is higher by 26–138 ppm for a high ECS, and lower by 11–52 ppm for a low ECS, compared to the reference run. Similar differences are seen in CH4 concentration but in ppb. By the end of the millennium, sea level rise from thermosteric changes is highly dependent on ECS, and ranges from ∼0.3–0.9 m in SSP1–2.6, to ∼0.5–1.7 m in SSP2–4.5.
The response of the land carbon cycle to climate changes is primarily controlled by two opposing feedback mechanisms. The first is the CO2 fertilization effect, which increases land carbon uptake and occurs because higher CO2 concentrations stimulate vegetation to consume more carbon via photosynthesis (negative land CO2–carbon cycle feedback). The second, warming-enhanced soil respiration, reduces land carbon uptake and occurs when CO2 is released from the soil from heightened microbial activity (positive land climate–carbon cycle feedback). The positive carbon cycle feedback as a whole (i.e. including the ocean) is driven mainly by the land carbon response (figures 2(a)–©) through the temperature dependence of soil respiration. Different ECS strongly impact the amount of carbon stored in soils, with a larger ECS resulting in less soil carbon (figures S9(g)–(i)), while changes in vegetation carbon are only marginal (figures S9(d)–(f)) and driven by changes in net primary production (figures S9(a)–©). In our simulations the positive climate–carbon cycle feedback dominates over the negative CO2–carbon cycle feedback as ECS increases.
Over the historical period (1850–2015 CE), vegetation carbon decreases due to land use change, while soil carbon increases. This changes during the 21st century as land becomes a net sink of carbon across all emission scenarios (figures 2(a)–©) from increases in net primary productivity (figures S9(a)–©). This agrees with earlier studies (Brovkin et al 2013). While increases in vegetation carbon are largely dependent on the SSP scenario over the 21st century (figures S9(d)–(f)), ECS has a large role in determining the magnitude of these changes. Globally, soil carbon shows an initial increase across the different SSP scenarios, reaching its peak earlier under high ECS values. This is followed by a rapid decrease, which results in the soil carbon reservoir being either a net source (high ECS) or net sink (low ECS), depending on climate sensitivity (figures S9(g)–(i)). A substantial part of the positive land carbon cycle feedback can be attributed to the changes in carbon stored in permafrost. More than 50% (61%–94%) of permafrost area is lost in simulations when ECS = 5 ∘C (figure S8), where the majority of held carbon is released back into the atmosphere (figures S10(g)–(i)). Although permafrost area decreases in simulations with a low ECS, the corresponding carbon loss in soil is dampened to some degree by an increase in net primary production (figures S10(a)–©) and a consequently larger carbon input to the soil. The higher the ECS, the less carbon is stored on land at all times. By the year 3000 CE in SSP1–2.6, the land stores 50 PgC more carbon than at pre-industrial if ECS = 2 ∘C, while it loses 240 PgC if ECS = 5 ∘C (figure S9(j)). Under the SSP2–4.5 scenario, this range broadens to an increase of 150 PgC for ECS = 2 ∘C, and a loss of 380 PgC for ECS = 5 ∘C (figure S9(l)). SSP4–3.4 exhibits significantly smaller land carbon compared to the pre-industrial period across the entire simulated period (1850–3000 CE) (figure S9(k)), primarily due to decreasing vegetation carbon associated with higher land-use change (figure S2(d)). The land can be either a net source or sink of CO2 emissions over the next millennium, depending on the dominant process (figures 2(a)–©) and S9(j)–(l)).
The positive climate–CH4 feedback arises from the temperature dependence of the simulated natural CH4 emissions (figures S6(a)–©) due to the fraction of total soil carbon respired as CH4 from wetlands increasing with temperature. The natural CH4 emissions are clearly dominated by tropical sources, with the extratropics playing a secondary role (figure S6).
The ocean serves as a carbon sink in all simulations (figures 2(d)–(f)) and the ocean carbon response is very similar for different ECS in our simulations (figures 2(d)–(f)). This is explained by the fact that the effect of accompanying changes in climate (positive ocean climate–carbon cycle feedback) and atmospheric CO2 concentrations (negative ocean CO2–carbon cycle feedback) on air-sea carbon exchange almost compensate each other. Still, the total ocean carbon uptake by 3000 CE is larger in experiments with higher ECS (figures S9(m)–(o)). While the strength of carbon cycle feedbacks depends on how different processes are represented in the model, land and ocean carbon cycle feedbacks in CLIMBER-X fall well within the range of the CMIP6 ensemble (figure 33 in Willeit et al 2023).
With high levels of global warming, as seen in all scenarios with a high ECS (figures 1(a)–©), it is rather likely that critical thresholds of some tipping elements of the Earth system would be breached, which could provide additional feedbacks not considered here (Winkelmann et al 2023, Wunderling et al 2024). This could have implications on sea level rise (from the Greenland and West Antarctic ice sheets), regional climate change (from the reorganization of ocean circulation, e.g. shutdown of the Atlantic Meridional Overturning Circulation), and ecosystems (from the Amazon rainforest dieback and West African monsoon shift). The impact of ocean acidification, deoxygenation, and warming, although not fully understood and only poorly accounted for in our model, could also lead to the crossing of critical thresholds with possible negative impacts on the ocean carbon sink (Heinze et al 2021). Although the net effect of all these changes on global climate is yet to be understood, our study demonstrates the non-negligible possibility that climate and carbon-cycle feedbacks can induce significant temperature changes, even within anthropogenic emission scenarios which are considered relatively ‘safe’. This warrants careful consideration and further investigations, and emphasizes the importance of properly accounting for all major climate-related feedbacks and associated uncertainties for future climate projections.
Mar. 24, 2025 Carbon cycle feedbacks may amplify global heating risk, study warns
Global heating over this millennium could exceed previous estimates due to carbon cycle feedback loops. This is the…..phys.org
notes:
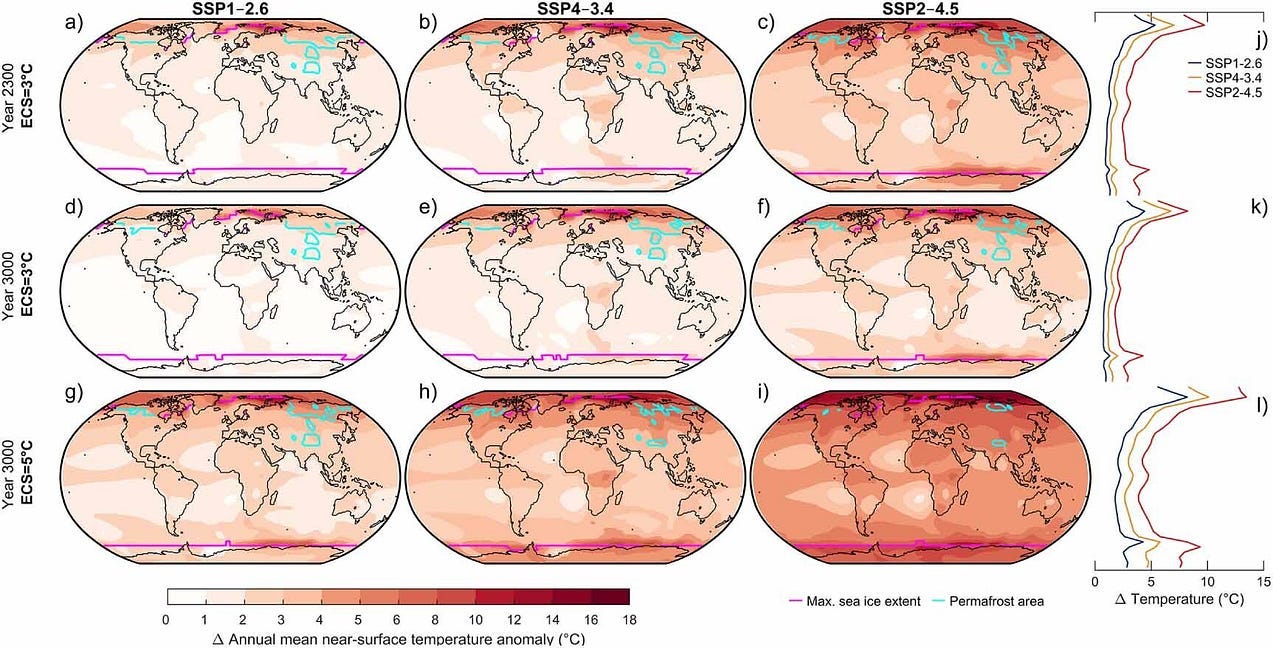
Global heating over this millennium could exceed previous estimates due to carbon cycle feedback loops. This is the conclusion of a new study by the Potsdam Institute for Climate Impact Research (PIK). The analysis shows that achieving the Paris Agreement’s aim of limiting global temperature rise to well below 2°C is only feasible under very low emission scenarios, and if climate sensitivity is lower than current best estimates. The paper is the first to make long-term projections over the next 1,000 years while accounting for currently established carbon cycle feedbacks, including methane.
“Our study demonstrates that even in emission scenarios typically considered ‘safe,’ where global warming is generally considered to remain below 2°C, climate and carbon cycle feedbacks, like the thawing of permafrost, could lead to temperature increases substantially above this threshold,” says PIK scientist Christine Kaufhold, lead author of the paper published in Environmental Research Letters.
“We found that peak warming could be much higher than previously expected under low-to-moderate emission scenarios.” The study projects the long-term impacts of human-induced climate change and underlines that even small changes in emissions could lead to far greater warming than previously anticipated, further complicating efforts to meet the Paris Agreement targets. “This highlights the urgent need for even faster carbon reduction and removal efforts,” Kaufhold says.
Most studies are too short-term to capture peak warming, as they end by 2100 or 2300. By running longer simulations and incorporating all major carbon cycle feedbacks, including the methane cycle, the researchers were able to assess the potential additional warming from these feedbacks and estimate the possible peak warming.
Climate sensitivity shaping future climate outcomes
The study’s simulations consider a range of equilibrium climate sensitivities (ECSs) between 2°C and 5°C, defined as “very likely” by the Intergovernmental Panel on Climate Change. The ECS is a critical measure in climate science, estimating the global temperature rise associated with a doubling of CO₂ concentrations.
“Our results show that the Paris Agreement’s goal is only achievable under very low emission scenarios and if the ECS is lower than current best estimates of 3°C,” says PIK scientist Matteo Willeit, co-author of the study. “If the ECS exceeds 3°C, carbon reduction must accelerate even more quickly than previously thought to keep the Paris target within reach.”
The paper highlights the important role ECS plays in shaping future climate outcomes while revealing the risks of failing to accurately estimate ECS. It emphasizes the urgent need to more accurately quantify this metric and better constrain it.
“Our research makes it unmistakably clear: today’s actions will determine the future of life on this planet for centuries to come,” concludes PIK director Johan Rockström, co-author of the paper.
“The window for limiting global warming to below 2°C is rapidly closing
Mar. 26, 2025 — Clouds may amplify global warming far more than previously understood
Tropical marine low clouds play a crucial role in regulating Earth’s climate. However, whether they mitigate or…..phys.org
notes: (reporting on paper from Jan 2nd)
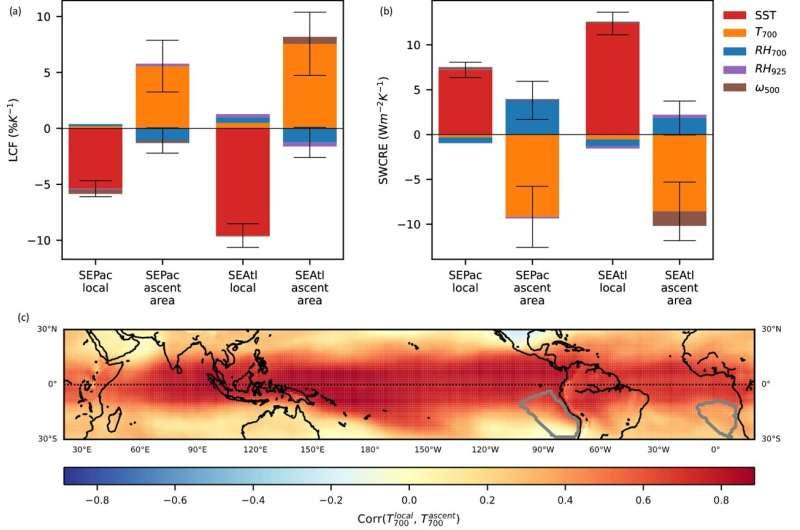
Tropical marine low clouds play a crucial role in regulating Earth’s climate. However, whether they mitigate or exacerbate global warming has long remained a mystery. Now, researchers from the School of Engineering at the Hong Kong University of Science and Technology (HKUST) have developed a method that significantly improves accuracy in climate predictions. This led to a major discovery — that tropical cloud feedback may have amplified the greenhouse effect by a staggering 71% more than previously known to scientists.
After comparing the model outputs to satellite observations, they successfully identified two critical cloud controlling factors that effectively capture the effects of SST warming patterns — local SST and lower troposphere temperature at approximately 3 km altitude.
The results revealed a 71% increase in the SWCF compared to model projections alone. Prof. Wu Mengxi, the first author of this work and a Research Assistant Professor at the Department of Civil and Environmental Engineering, explained the findings meant Earth’s climate can be much more sensitive to rising carbon dioxide levels than many models have previously estimated.
“Although tropical low clouds can provide a cooling effect, our study rules out the possibility that the cooling effect could become stronger with surface warming caused by increasing greenhouse gases,” he said.
“The results not only narrow the uncertainty in one of the largest unknowns in climate science, but also enable more accurate predictions of how much warming we might expect. This allows us to prepare better for the challenges of climate changes,” Prof. Wu added.
Tropical marine low clouds play a crucial role in regulating Earth’s climate. However, whether they mitigate or…www.sciencedaily.com
notes:
more coverage of Jan. 2nd paper.
Mar. 27, 2025 — Clouds: are we ignoring a crucial driver of recent global warming?
Typically, clouds are counted as contributors to planetary albedo - but are all clouds the same? Jed Thomas Clouds play…
www.envirotech-online.com
notes: reporting and analysis
One of the most concerning cloud feedback mechanisms is the potential decrease in low-altitude clouds as temperatures rise. Several factors contribute to this reduction:
Increased atmospheric stability: As greenhouse gases trap more heat, the upper troposphere warms more than the surface. This suppresses convective mixing, making it harder for low clouds to form.
Higher lifting condensation level (LCL): A warmer atmosphere requires rising air to travel farther before it cools enough to condense into clouds. This reduces the formation of low clouds.
Stronger subsidence in high-pressure zones: Warming intensifies large-scale atmospheric circulation patterns, increasing the downward movement of dry air, which suppresses low cloud formation, particularly over oceans.
Infrared-induced cloud burn-off: More longwave radiation from the surface heats and evaporates low clouds, thinning them out and reducing their coverage.
Since low clouds are highly reflective, their loss means more sunlight reaches the surface, causing further warming — a classic positive feedback loop.
While low clouds tend to decrease, high clouds are expected to increase in a warming world. This also creates a positive feedback effect:
More water vapor in a warmer atmosphere: Since warmer air holds more moisture, high-altitude cloud formation increases.
Greater greenhouse effect from cirrus clouds: High clouds are poor at reflecting sunlight but excellent at trapping heat. Their increase strengthens the greenhouse effect.
Delayed infrared emission to space: Because high clouds are cold, they radiate less energy to space, further enhancing warming.
Current climate models suggest that cloud feedback is predominantly positive, meaning it amplifies rather than mitigates climate change.
Observational studies, satellite data, and high-resolution models increasingly show low cloud coverage declining in key regions (e.g., subtropical oceans), reducing reflection of solar radiation, whilst high cloud coverage increases, enhancing the greenhouse effect.
Similarly, reductions in aerosols will decrease the formation of low-altitude clouds and there will be fewer reflective particulates in the atmosphere, too.
Some researchers, including James Hansen and colleagues, argue that climate sensitivity — how much warming results from a given CO₂ increase — may be higher than previously estimated due to underestimated cloud feedback strength.
Despite strong evidence for positive cloud feedback, significant uncertainties remain. Cloud formation and behavior are highly complex, and small-scale cloud processes are difficult to model with precision.
The key areas of uncertainty include the exact magnitude of low cloud reduction and its impact on future warming; regional variations in cloud feedback effects, particularly in the tropics and mid-latitudes; and how cloud-aerosol interactions will evolve as air pollution declines globally.
However, given the mounting observational evidence and improved climate models, it is increasingly clear that cloud feedback is not just a secondary factor but a major amplifier of climate change.
According to Hansen et al, cloud feedback is responsible for almost two thirds of the reduction in Earth’s albedo, which they believe has been occurring since 2000.1
Cloud feedback is one of the most critical and uncertain aspects of climate change projections. The loss of reflective low clouds and the increase in heat-trapping high clouds both contribute to a net positive feedback loop, reinforcing global warming.
As scientists refine climate models and gather more observational data, there have been calls for higher climate sensitivity estimates, suggesting that future warming could be more severe than previously anticipated.
Understanding and quantifying these cloud-climate interactions remains a top priority for climate science and policy planning.
Mar. 28, 2025 — Clouds changing as world warms, adding to climate uncertainty
People have always studied the skies to predict the weather, but recently scientists have noticed that clouds are…..www.france24.com
notes:
clouds are not uniform — they act differently depending on their type, structure and altitude.
Fluffy, low-hanging clouds generally have a cooling influence. They are big and bright, blocking and bouncing back incoming sunlight.
Higher, streaky ones have a warming effect, letting sunlight trickle through and absorbing heat reflected back from Earth.
In recent decades, scientists have observed a growing imbalance between the amount of energy arriving, rather than leaving Earth, hinting at cloud changes.
As the climate has warmed, certain clouds have drifted higher into the atmosphere where they have a stronger greenhouse effect, said Hogan.
“That actually amplifies the warming,” he said.
This is growing evidence that lower clouds are also changing, with recent studies pointing to a marked decline of this cooling layer.
Less reflective cloud exposes more of Earth’s surface to sunlight and boosts warming in a “vicious feedback cycle”, said climate scientist Richard Allan from the University of Reading.
In March, Allan co-authored a study in the journal Environmental Research Letters that found dimmer and less extensive low-lying clouds drove a doubling of Earth’s energy balance in the past 20 years, and contributed to record ocean warmth in 2023.
A study in December, published in the journal Science, also identified a sharp drop in low-lying cloudiness as a likely culprit for that exceptional warming.
Stevens said scientists generally agreed that Earth had become less cloudy — but there are a number of theories about the causes.
“Clouds are changing. And the question is how much of that change is natural variability — just decadal fluctuations in cloudiness — and how much of that is forced from the warming,” he said
Another theory is that decades-long global efforts to improve air quality are altering the formation, properties and lifespan of clouds in ways that are not yet fully understood.
Clouds form around aerosols — tiny airborne particles like desert dust and sea salt carried on the wind, or pollution from human activity like burning fossil fuels.
Aerosols not only help clouds take shape, but can make them more reflective.
Recent research has suggested that clean air policies — particularly a global shift to low-sulphur shipping fuel in 2020 — reduced cloud cover and brightness, inadvertently pushing up warming.
Allan said aerosols were one factor, but it was likely lower clouds were also “melting away” as the climate warmed.
“My feeling is there’s a combination of things. It’s never one simple smoking gun,” he said.
OTHER TOPICS
Agriculture in the Crosshairs: Breadbasket Collapse at 2°C and 3°C
The stability of global food systems hinges on a handful of critical "breadbasket" regions-the U.S. Midwest, Canada's…
collapseofindustrialcivilization.com
Heat stored in the Earth system 1960-2020: where does the energy go?
Abstract. The Earth climate system is out of energy balance, and heat has accumulated continuously over the past….essd.copernicus.org
A Glimpse into the Future: The 2023 Ocean Temperature and Sea Ice Extremes in the Context of…
Abstract In the year 2023, we have seen extraordinary extrema in high sea surface temperature (SST) in the North…..journals.ametsoc.org
-Unprecedented ocean heating shows risks of a world 3°C warmer
New research examines the causes of the record-breaking ocean temperatures witnessed in 2023…..www.sciencedaily.com
Ocean-surface warming four times faster now than late-1980s
The study helps explain why 2023 and early 2024 saw unprecedented ocean temperatures…..www.sciencedaily.com
Mar. 27, 2025 — Abrupt sea level rise and Earth’s gradual pole shift reveal permanent hydrological regime changes in the 21st century
This was one of the most compelling installments of The Crisis Report I’ve read so far. It’s rare to come across a source that dives into the complexity of global events without collapsing into sensationalism or oversimplification. What I appreciate most about your writing is the balance—between historical context and present urgency, between data and intuition, between what’s happening now and what it might mean for the road ahead.
The way you frame geopolitical tensions feels both sober and grounded. It’s clear you’re not simply reporting events but actively trying to map out the patterns behind them—what they signal, what they echo from the past, and what might emerge as a result. In a time when much of the media rewards outrage or shallow hot takes, your thoughtful, layered approach is genuinely refreshing. It invites the reader to think critically rather than react impulsively—and that alone sets your work apart.
There’s a unique kind of trust that builds when someone presents information with integrity and without an agenda. Your willingness to ask hard questions while resisting the urge to jump to conclusions gives your work a depth that’s missing in many mainstream analyses. Whether you’re discussing the shifting alliances, economic tremors, or the underlying psychological tone of leadership decisions, your tone is clear: stay informed, stay vigilant, and above all—stay human.
What stood out to me in this particular issue was the focus on interconnectedness. You highlighted not just isolated crises, but how seemingly unrelated events—political, environmental, financial—are part of a larger, often invisible system. That kind of systems thinking is vital right now, especially as so many people are feeling overwhelmed or confused by the pace and scope of global change. It’s one thing to point to problems—it’s another to help people see the threads that connect them. You do that consistently, and it matters.
There’s also a quiet emotional intelligence behind your analysis. You don’t lean on fear, but you also don’t sugarcoat. You remind us that crisis is not just danger—it’s also a turning point. And how we respond, individually and collectively, is what defines what comes next. That resonates deeply with anyone who believes in personal responsibility and ethical leadership, even at the smallest scale.
In many ways, reading The Crisis Report feels like a practice in clarity. It’s not just information—it’s perspective. And in a world where attention is fragmented and facts are often weaponized, the clarity you offer is more than useful—it’s essential.
Thank you for doing this work with such consistency, depth, and care. These insights are not just timely—they’re necessary. Please keep going. Your voice is helping people see more clearly in a time that desperately needs it.
My BA was in anthropology--a long time ago. But even then, collapse was implied in any cultural anthro course discussing a culture's timeline. We just don't want to believe it is happening to our culture. Doubtless, some writers want to protect territory and then there are those with a paycheck or ideology get in the way. But with a doctorate in anthropology, you are more than qualified to discuss collapse.