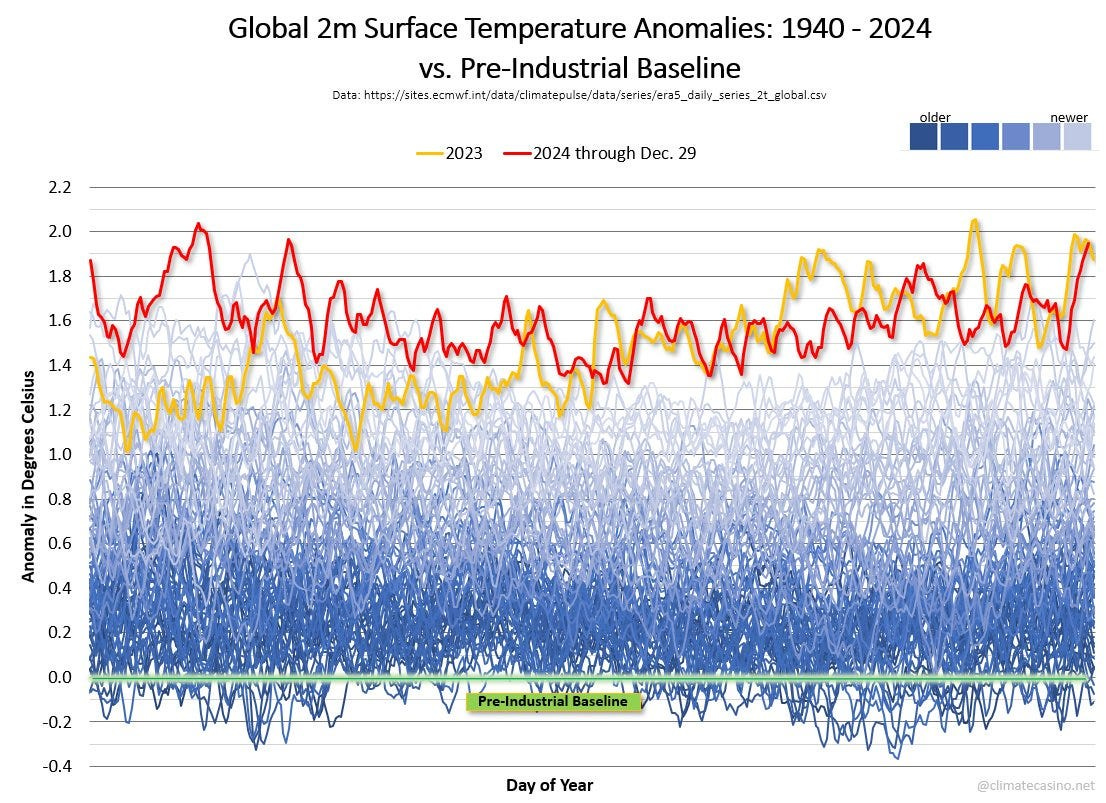
There are several DEEPLY disturbing things about this graph. Let’s start with the most obvious.

The Global Mean Surface Temperature (GMST) for DECEMBER was +1.9°C above the “Pre-Industrial” baseline. On average, 2024 was +0.1°C HOTTER than 2023.

2023 was an “El Nino” year. Everyone knew that a LOT of HEAT had built up in the oceans. Everyone expected that temperatures could go up quiet a bit, TEMPORARILY. Then, it was expected, they would drop back down.
That's how El Ninos work.
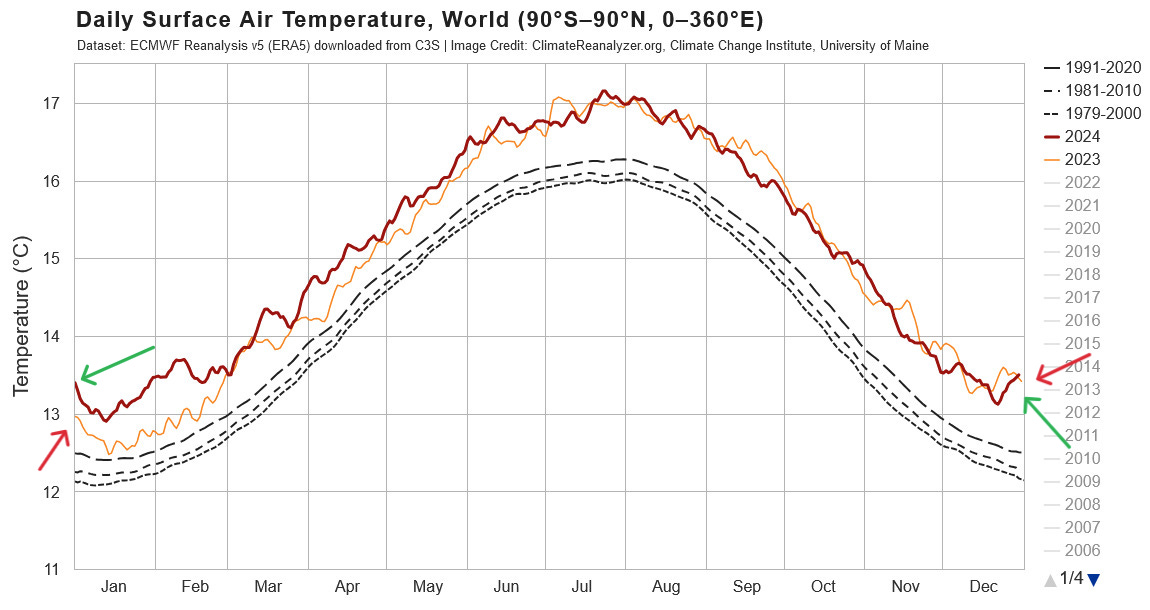
2024 WASN’T “normal”.

THINK ABOUT THAT.
Despite being the back half of an El Nino when massive amounts of HEAT bled out of the oceans.
Despite the formation of a La Nina pattern by the Fall. Which should have cooled things down.
Despite both of these things.
The Global Mean Surface Temperature actually WENT UP another +0.1°C in 2024.
In 2020 at the end of the 2019/2020 El Nino, the GMST was about +1.2°C over baseline. At the end of that year temperatures were on the decline and 2021 was about -0.1°C cooler than 2021.
Remember this?

The “Observed Warming” for 2021 was officially +1.1°C relative to an 1850–1900 average baseline. Note the black “whisker line”. They were telling us that there “might be” as much as +0.9°C of “masked” or “hidden” warming in the Climate System.
Since 2021 the GMST has increased to +1.6°C. The average temperature for 2024 was +1.6°C over baseline.
That’s a +0.5°C increase in just THREE YEARS. A Rate of Warming of about +0.16°C PER YEAR on average over the last 3 years. Mainstream, Moderate Climate Science has been completely unable to explain what's happening. James Hansen and I both predicted it in early 2022.
The Crisis Report — 02 (Medium)
The UN has confirmed that we are about to get a massive temperature spike.
In early 2022 the IPCC was saying that there was a 50:50 chance that the GMST would “temporarily” exceed +1.5°C over baseline before dropping back to about +1.3°C after the next El Nino.
Earth Stands ‘50:50’ Chance Of Passing 1.5 Degrees Warming Within 5 Years — Forbes
Fifty-fifty chance’ global warming hits 1.5°C by 2026, warn scientists — Euronews
There’s a 50:50 chance the planet will pass the 1.5C warming threshold in the next 5 years — CNN
World has 50–50 chance of hitting 1.5C mark soon: U.N. — Frontline India
Forecasters also say there’s a 93% chance that the five years from 2022 to 2026 will be the hottest on record.
LOL, they got that part right.

According to the “mainstream” climate models it should be only +1.3°C over baseline right now. Instead it’s +1.6°C and STILL CLIMBING.
James Hansen forecast about +0.6°C of warming during the El Nino up to +1.7°C. Followed by a drop back to about +1.5°C “sustained” at its end. Hansen was a little bit, about -0.1°C, low in his forecast.
I forecast +0.8C of warming during the El Nino up to +1.9°C. Followed by a drop back to about +1.7°C “sustained” at its end. I was a little bit, about +0.1°C, high in my forecast.
Here's what has happened.
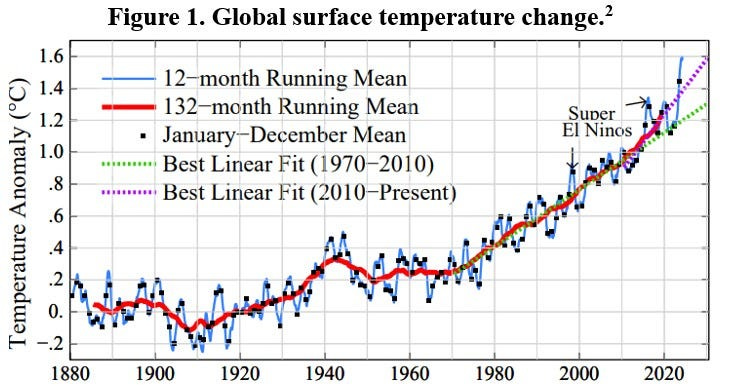
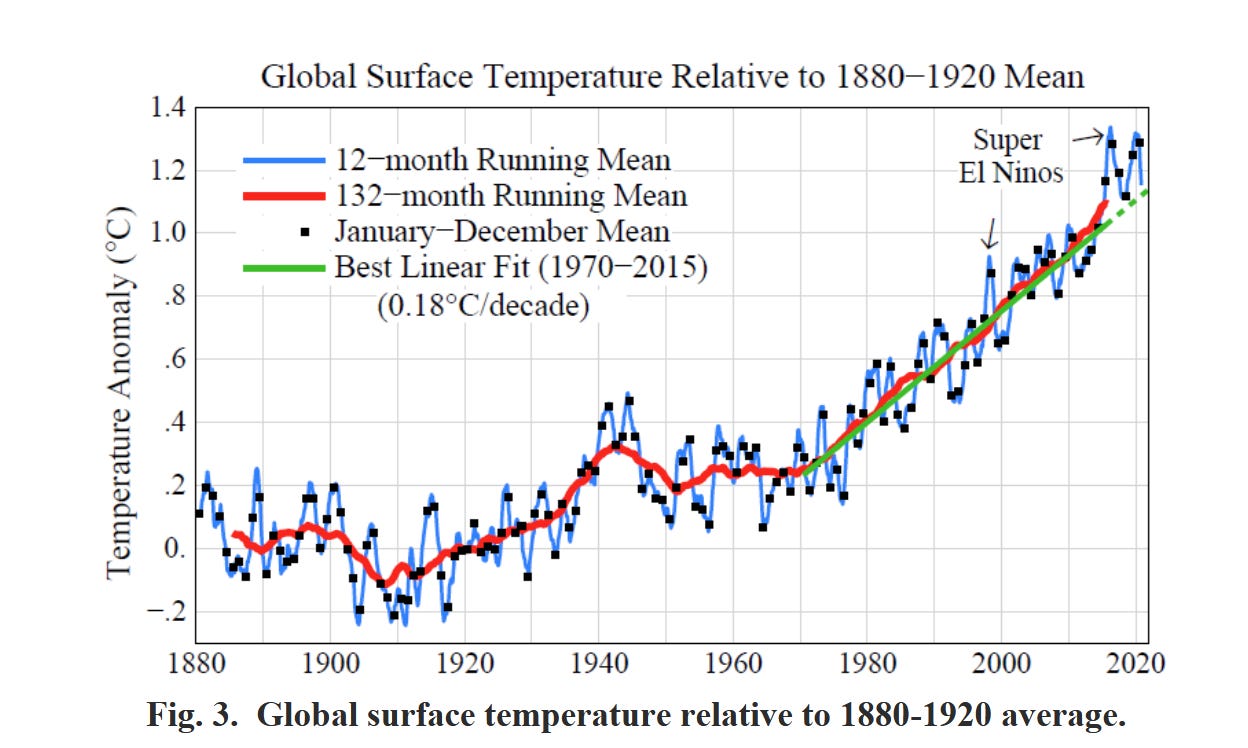
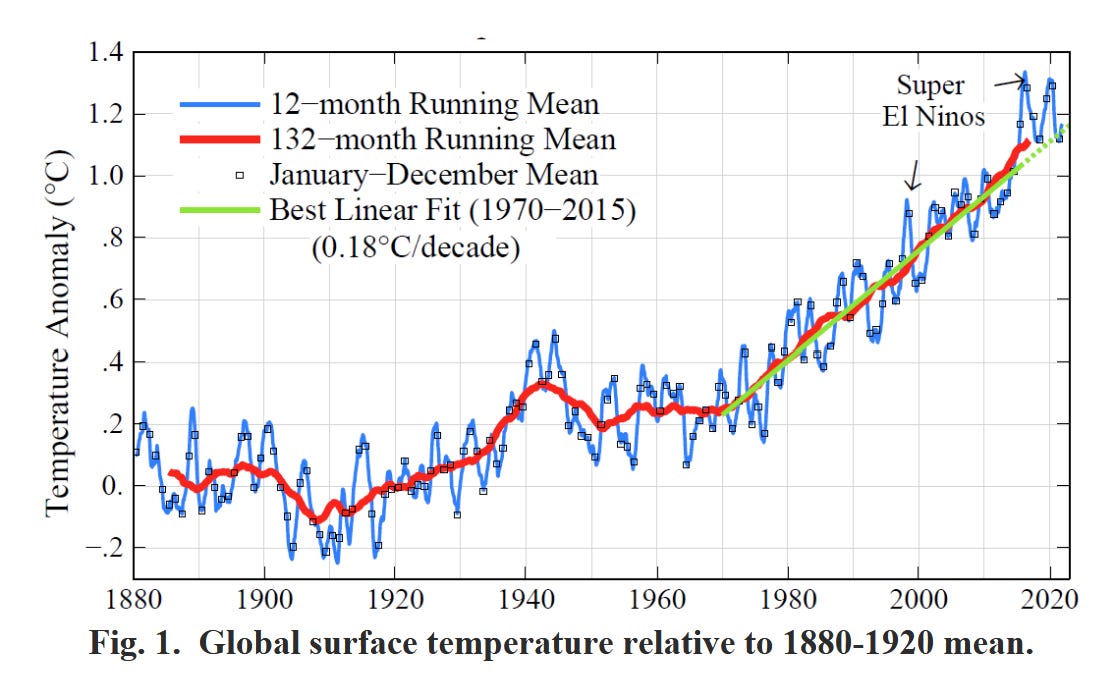
Now, if you have been following my articles this graph will be familiar to you. Hansen started using this graph in January of 2021 and has been publishing updates every since. Here's what it looked like then.

Already the “divergence” between what the Moderate GCMs (General Climate Models) predicted and “emerging acceleration” of the Rate of Warming is apparent. Here's what Hansen said in January 2021.
“Interannual variability of global temperature is highly correlated with the Southern Oscillation, the El Niño/La Niña cycle.”
Meaning — the GMST strongly correlates with the amount of HEAT in the Pacific Ocean.
“The rate of warming had been almost constant for several decades, at about +0.18°C/decade, if short-term variability is removed by the linear trend or 132-month (11-year) running mean.”
See the GREEN line. That's the +0.18°C/decade Rate of Warming (RoW) Hansen is talking about. Starting about 1975, the RoW increased from +0.08°C/decade to +0.18°C/decade. Then it stayed there for about 40 years, until 2014.
“However, data for recent years suggest that the warming rate may be accelerating.”
See the RED line. See how in 2014 it starts to diverge from the green line of +0.18°C/decade and get steeper. That's ACCELERATION of the Rate of Warming.
In 2021 there was a LOT of debate in Climate Science about whether this “divergence” was meaningful or just “natural variability”. The Moderates held HARD to the idea that the RoW was NOT ACCELERATING.
Here's what was happening with the ALBEDO in 2014. From Earth’s Albedo 1998–2017 as Measured From Earthshine pub. Aug 2021

This DIMMING of the albedo represents a MASSIVE flood of ENERGY from the Sun going into the Climate System. This has NOTHING to do with CO2 levels which seems to be confusing to the mainstream media.

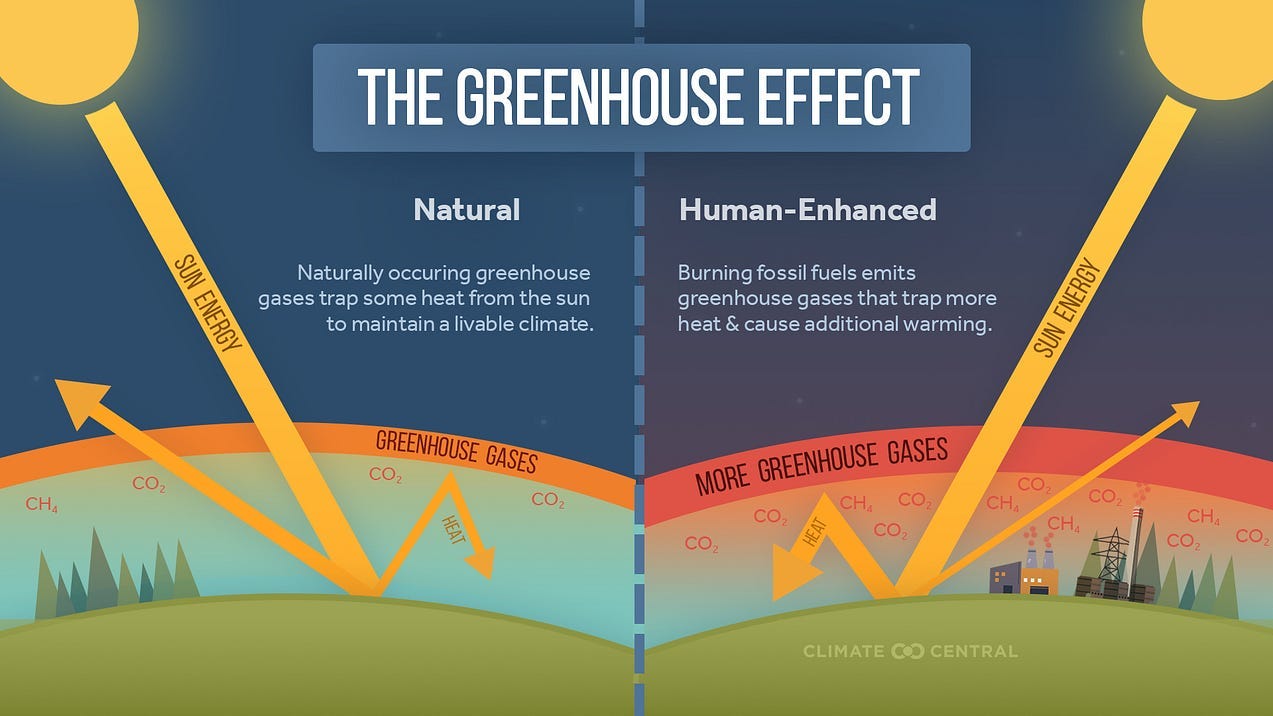
The Albedo is the “gatekeeper” that controls HOW MUCH energy gets into the Climate System. CO2 and CH4, the main greenhouse gases that humans produce in powering our civilization, TRAP energy that’s already in the Climate System and prevent it from escaping.
Now, there are some REALLY important things to understand about our planet and its Climate System.
Here's the biggest.
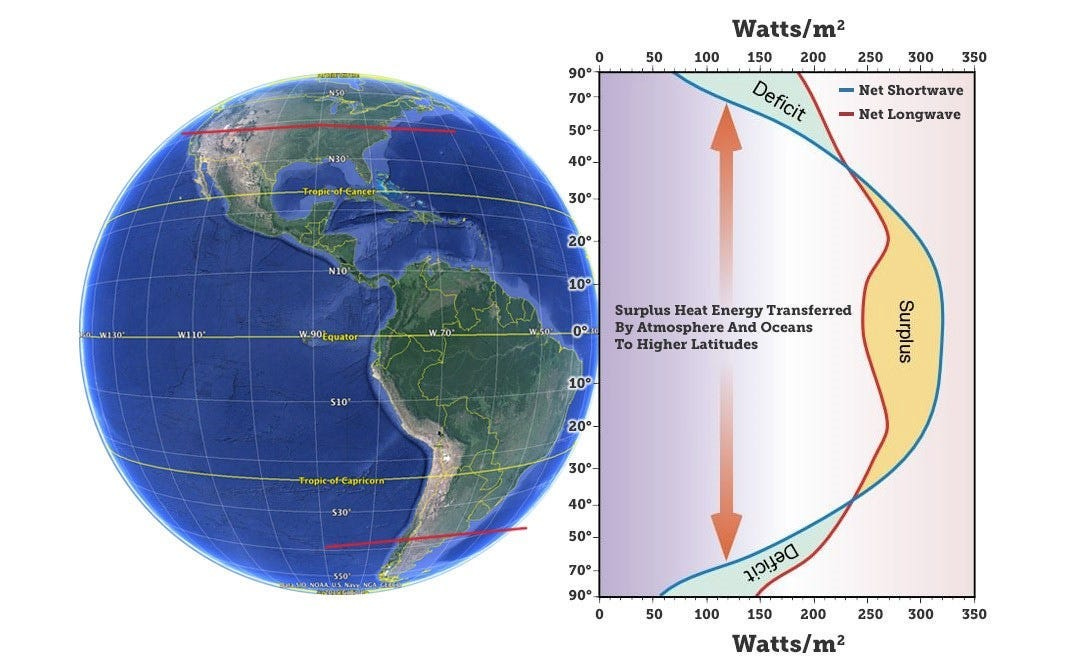
Due to axial tilt, not all latitudes on earth are “equal” when it comes to capturing ENERGY from the Sun.
EIGHTY PERCENT of the ENERGY going into the Climate System happens along the equator, in the zone known as the Tropics.
The other 20% happens between the yellow lines in the “subtropics”. ALL of the area above the yellow lines in each hemisphere, the “Temperate Zones” and the “Frigid Zones”, loses more ENERGY each year than it takes in from the Sun.
Once again there is a lot more land in the Northern Temperate Zone than in the Southern. Also once again, the temperate zones are dominated by ocean. Which brings me to the second REALLY important thing to understand about the Climate System.
NINETY PERCENT of the ENERGY in the Climate System is in the Oceans. Global Warming is actually Ocean Warming.
Notice how HUGE the Pacific Ocean is when compared to the North Atlantic, South Atlantic, and Indian Oceans. The Pacific holds a LOT of HEAT. So much, that the cycles of the Pacific set the temperature for the planet.
“Interannual variability of global temperature is highly correlated with the Southern Oscillation, and the El Niño/La Niña cycle.” — James Hansen
The REASON I am stressing this, is that you cannot understand what's happening RIGHT NOW. If you don't understand how the ENERGY flow in the Climate System works. Our discussions focus almost entirely on the GHG (CO2 and CH4) aspect of global warming.
We “obsess” over getting to “Net Zero” yearly CO2 increases in the atmosphere. The Moderates in Climate Science THEORIZE that when this happens, the GMST will IMMEDIATELY stop going up and will level off.

Nowhere in these models is there a scenario for a “dimming” of the ALBEDO.
The Climate System reduced to its most basic level is this.
ENERGY goes into the System → ENERGY flows from the Tropics to the Poles → ENERGY bleeds out of the System → The difference between those two is the EEI (Earth Energy Imbalance).
If the EEI is negative the Earth is cooling.
If the EEI is positive the Earth is warming.
That’s the simple version. The “slightly” more complex version looks like this.
ENERGY from the SUN + ENERGY trapped by Green Houses Gases goes into the Oceans → ENERGY flows from the Tropics to the Poles → ENERGY bleeds out of the Oceans → The difference between those two is the EEI (Earth Energy Imbalance).
Annual ENERGY from Sun plus ENERGY trapped by GHGs minus ENERGY radiated to space = Annual Earth ENERGY Imbalance (EEI) expressed in Watts per square meter (W/m2).
This makes it VERY CLEAR that CO2/CH4 levels are only part of the “energy equation” for our planet. The amount of ENERGY that goes into the Climate System from the SUN is the “other half” of the “Climate Forcing” warming our planet.
The WARMING since 2014 has LITTLE to do with CO2 levels or even CH4 increases. They are TRIVIAL by comparison to the decline in the ALBEDO and the increase in ENERGY flowing into the Climate System as a result of that change.
This was January 2020.

As I mentioned earlier, Hansen has been updating this graph on a semi-regular basis. Here is a time-lapse look at the warming since 2020.
Hansen’s prediction for 2024.
“Finally, we suggest that 2024 is likely to be off the chart as the warmest year on record. Without inside information, that would be a dangerous prediction, but we proffer it because it is unlikely that the current La Nina will continue a fourth year.”
“Even a little futz of an El Nino — like the tropical warming in 2018–19, which barely qualified as an El Nino — should be sufficient for record global
temperature. A classical, strong El Nino in 2023–24 could push global temperature to about +1.5°C relative to the 1880–1920 mean, which is our estimate of preindustrial temperature.”
He was -0.1°C too LOW.
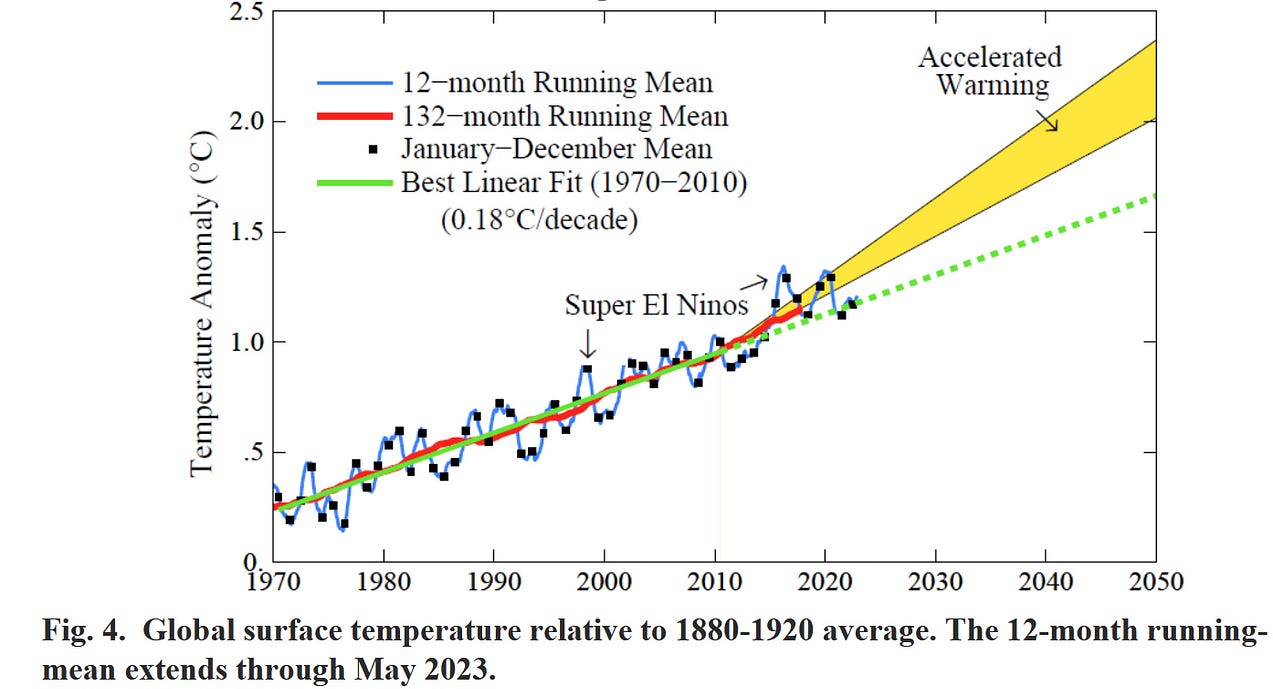
From the article.
“there has been a staggering increase in Earth’s energy imbalance”

About 90% of the change of EEI is change of the heat content of the ocean, which is sampled by a fleet of about 4000 deep-diving Argo floats.
Earth’s energy imbalance was +0.71 W/m2 during the 10-year calibration period, but EEI has subsequently increased to well over 1 W/m2 (Fig. 3).
EEI provides the direct driving force for global warming and all of the consequences thereof.
It is this increased EEI that leads us to project a 50–100% increase in the rate of global warming during the few decades following 2010. — James Hansen June 2023
If our projection is correct, we expect observed global temperature to rise into the yellow region in Fig. 4 in 2023 and above the yellow region in 2024.
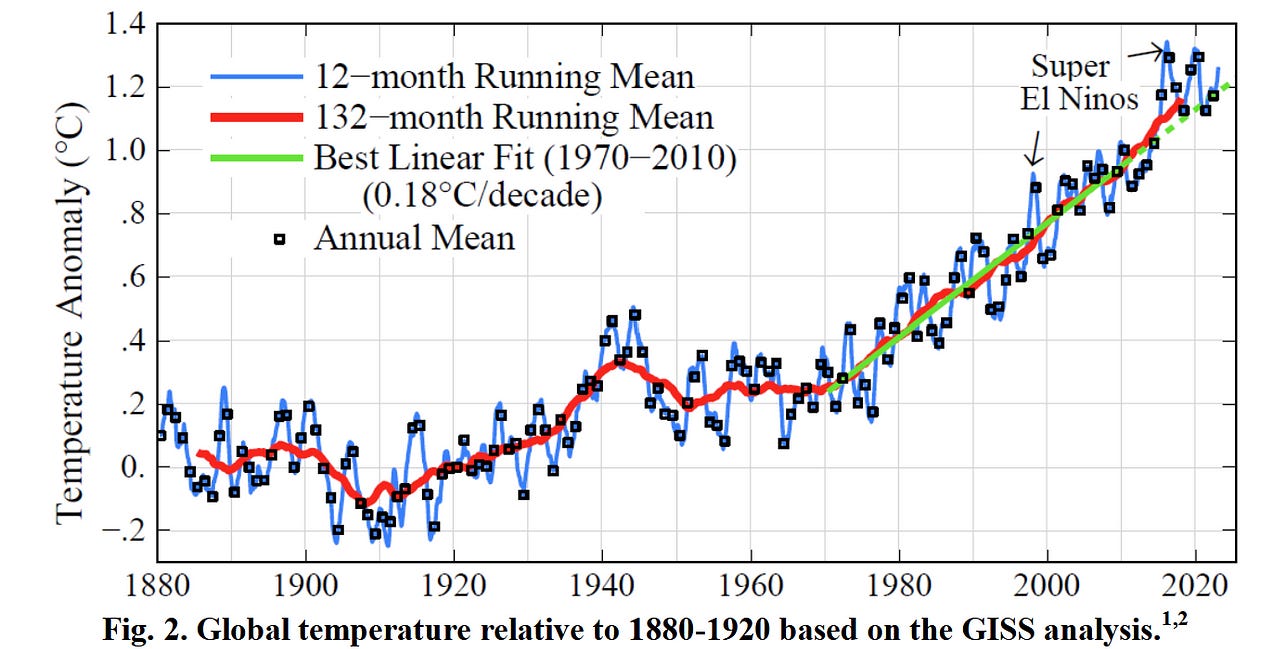


From the article.
“The proximate cause of the (warming) acceleration is increase of Earth’s energy imbalance, specifically a substantial darkening of the planet (decreased albedo) equivalent to a CO2 increase of more than 100 ppm.”
“Although it is difficult to apportion the albedo change between aerosol forcing and cloud feedbacks because of limited global measurements.”
“Large 2023 warming is consistent with key findings in Global Warming in the Pipeline. Specifically reduced aerosol cooling and high climate sensitivity.”
“We expect record monthly temperatures to continue into mid-2024 due to the present large planetary energy imbalance, with the 12 month running-mean global temperature reaching +1.6–1.7°C relative to 1880–1920 and
falling to only +1.4 ± 0.1°C during the following La Nina.”
Hansen NAILED how HOT 2024 was going to get. The GMST average for 2024 was +1.64°C over baseline. HOWEVER, 2024 did NOT cool down the way he expected. 2024 actually got HOTTER, even though a La Nina pattern has formed in the Pacific.


Which brings us back to TODAY.
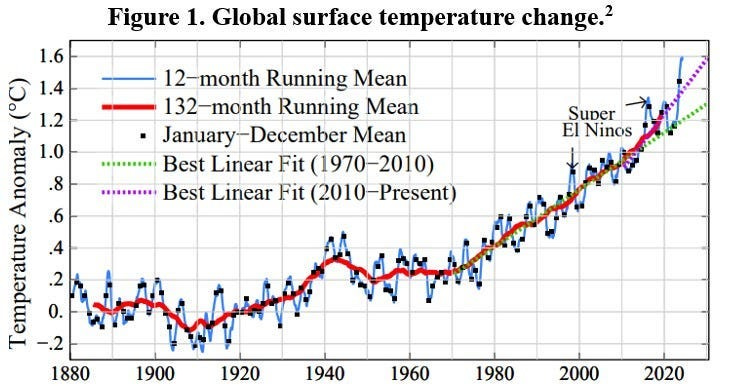
The average monthly temperature for 2024 has been +1.6°C above baseline.
Hansen and EVERYONE else in Climate Science is PRAYING that the La Nina pattern will cool things down in 2025. That the BLUE line will “top out” and then drop down to the PINK line.
IF, a BIG IF.
It does that, then the GMST in 2025 would be about +1.5°C with a Rate of Warming of +0.32°C/decade.
If 2025 doesn't drop down to the PINK line.
Then the Rate of Warming could be “substantially” higher than +0.32°C/decade. I think it's possible it could be around +0.4°C/decade at this point.
The difference between these positions seems small.
However, it's the difference between hitting +2°C (sustained) in the 2030–2035 time frame (my forecast) and hitting +2°C around 2040 (Hansen and the Alarmists).
The Moderates expect +2°C between 2040 and 2045 (unless we get to Net Zero before then).
I am forecasting +3°C (sustained) of warming by 2050.
Hansen and the Alarmists think +3°C around 2060.
The Moderates expect +3°C between 2060 and 2070 (unless we get to Net Zero before then).
ARE YOU GETTING THE MESSAGE?
EVERYONE who seriously understands Climate Science thinks we are about to have a RAPID run-up to +3°C, unless we get to Net Zero in the next 20 years.
DOES IT LOOK LIKE “NET ZERO” is going to happen?
If your child is born this year, they are likely going to live through +1.5°C of warming by the time they are 25. A fact that is likely going to cause a 40% to 50% drop in the global food supply and a reduction of 2.5 billion — 4 billion in the global population by 2050, at a minimum.
Do you REALLY think the “world as you knew it” is still going to exist in 2050, or even 2035?
2024 was the year we left “known waters” and sailed off the map.
Now we are in “uncharted” territory.
Here there be MONSTERS.
This is my analysis.
This is what I see.
This is my “Crisis Report”.
rc 010625
Personal Thoughts:
I took most of the last month off. I’m just not going to be the “skunk at the wedding” telling people how BAD things are getting while they are spending cherished time with their loved ones.
We all deserve a break after 2024.
2025 is shaping up to be REALLY BAD.
Things are moving faster now and WAR is coming.
Things are about to DRASTICALLY change in the world. The “good times” of the 20th century golden age of relative peace and plenty are coming to an end.
It’s NOT the “end of the world”.
It is the END of “life as we knew it”.
The life we all thought we were going to have ended in 2024. That future is gone. In its place is a dark smokey cloud that smells like burning, blood, and death.
There is ZERO CERTAINTY now about the future.
Here is ALL you can know for sure.
The rest of your life is going to be about things collapsing, sudden disasters, constant food insecurity, and repeated relocation.
Starting NOW.






Thank you Richard...I savored the last bit of 2024, with the Christmas lights and actually a bit of snow (which I wonder if it will be the last in my lifetime) and enter 2025 mentally prepared and preparing for the worst, if I can even imagine it...Thank you for helping me these past 2 years to get informed and get ready...
Thanks for the concerted effort, Richard, but that firehose of disparate data streams has left my old head aspin. I hang my hat on the EU's C3S, and they typically use the 1991-2020 baseline for global temp. comparisons. So, today, they show (with a 48hr. lag) an anomaly of 0.73 degC for land surface air temp. over the baseline, and a sea temp global ave. of 0.48 over baseline. They published "Hottest May on record spurs call for climate action", in which they gave 0.75 degC increase over baseline for a recent 12 mo. recording period, which I make to be 0.214 degC annual ave. increase. If so, then all of your/IPCC/etc. numbers using the misleading 1850-1900, etc. baselines, etc., are far too conservative and misleading as to the real, rapid global temp. increase, which may be 1 degC every 5 yrs., reaching 3 degC by 2032. But the even greater and more disturbing story is told in the 1.2 trillion tons of melting global ice worldwide, where each melting pound is absorbing 144 BTUs of heat energy, that's 3.3 billion tons per day. Eliot Jacobson has told us that we are pumping the heat energy equivalent of 20+ Hiroshima nuclear bomb blasts PER SECOND into the atmosphere, where each one releases 63 trillion BTUs. So, even with our planet's AC on high, we are still accumulating heat energy at the most rapid rate in history. Please, tell me if I'm wrong. Gregg