The Crisis Report - 43
More evidence is accumulating that our Climate Sensitivity models are off.
This is not good news.
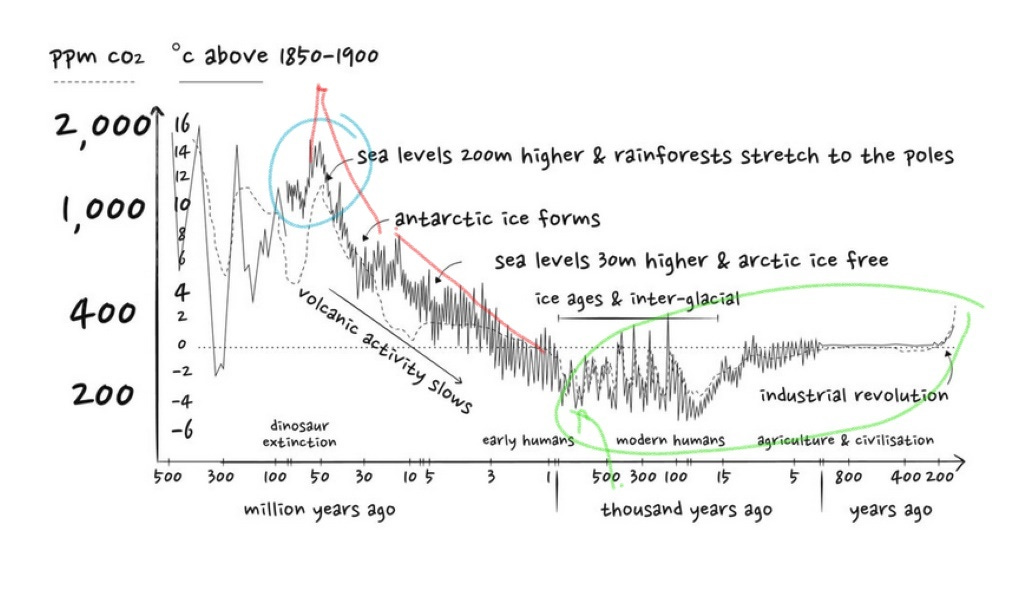
I love this graph.
It has issues because it compresses 500my of climate history into just four inches but, it’s beautiful. This graph represents one of the great scientific achievements of the twentieth century.
Think about it. In 1957/1958, when The International Geophysical Year was declared by the UN, none of this was known. A global network of standardized weather measurement stations wasn’t established until 1880.
Which is the rational the Fossil Fuel Elites used during the Trump years to have global warming measured from 1880. 1880 was the hottest year of the 19th century, by a lot.
How much has the Earth warmed up since the “preindustrial” period? Surprisingly it’s hard to get a straightforward answer to that question.
How 1.2C became "the number" for the amount the Earth has warmed.
So, in 1958 we had less than 100 years of standardized global weather measurements and NO understanding of the Earth’s paleoclimate record. In just over 60 years we have done an analysis of the Greenland Ice Cores.

And, we have done an analysis of the earth’s paleoclimate record for the last 500 million years. Which generated the graph I love so much.
If you want to do a deep dive into the history and science of this project I personally recommend the book, “Under a Green Sky: Global Warming, the Mass Extinctions of the Past, and What They Can Tell Us About Our Future by Peter Ward (2007)”. When I wanted to understand what the paleoclimate science looked like, this book was my starting point.
Ward is a paleontologist and the book is a deep dive into paleontology, particularly the field of paleoclimate research. While it is dense in places Ward does his best to make it as accessible as possible to the average reader. He wants people to read this book and understand what the world will be like in a few hundred years if we trigger a runaway greenhouse climate shift.
Ward writes,
“I’m scared as hell, and I’m not going to be silent anymore! This book is my scream, …Is [mass extinction] happening again? Most of us think so….Thus this book, words tumbling out powered by rage and sorrow, but mostly fear, not for me, but for my children and their descendants.”
There are newer books but this one is among the best. What’s important is that we have this incredible record of the earth’s climate history for 500 million years. A record which calibrates CO2 concentrations in the atmosphere with the earth’s temperature.
This record is important, and worth spending 60 years of effort on. Because it provides a “reality check” on our theoretical models of the climate system response to increasing levels of CO2.
What the paleoclimate data indicates is that our climate models have underestimated the earth’s climate sensitivity.

Now, in 1850 at the start of the Industrial Revolution the CO2 level was about 280ppm. Here’s the question we should have gotten the answer to before we started burning fossil fuels without any regulation.
How much CO2 does it take to raise the Earth’s temperature by one degree when CO2 levels are at 280ppm?
This is not a trivial question. It is the essential question of Climate Change and a lot of evidence is accumulating that we got it wrong.
Here’s a new piece of evidence that was released on June 30th of 2022.
Cenozoic evolution of deep ocean temperature from clumped isotope thermometry :
Science/30 Jun 2022/Vol 377, Issue 6601 pp. 86–90/DOI: 10.1126/science.abk0604
It sounds so innocuous and vaguely boring doesn’t it?
Here’s why it’s important.
“In this paper recently published in Science, Professor Nele Meckler of the University of Bergen and colleagues argue that the climate between around 35 and 60 million years ago may have been considerably warmer than we thought. Their finding suggests that a given level of CO2 might produce more warming than prior work indicated, and it hints that the ocean circulated differently during that warm, ice-free climate.”
I encourage you to read the paper’s abstract and then the article. It does a better job than usual in explaining what the paper means and the science of it. The thing I want to focus on is this:
The new method indicates that between 57 and 52 million years ago, the North Atlantic abyss samples show the global temperature was about 20°C warmer than our 1850 baseline. That’s a big difference from the oxygen isotope data, which yielded temperatures of 12–14°C. “That’s a whole lot warmer,” said Meckler.
For comparison, measurements with this technique on current sediments indicate warming between 1–2°C. Meckler’s technique is accurate.
This is bad news.

Because it implies that 1,800–2,000ppm of CO2 in the atmosphere could raise the earth’s temperature by 20℃ instead of the “milder” 14℃-16C indicated on the graph.
Which indicates an “under read” of climate sensitivity in the deep paleoclimate record (older than 5mya) of about 40%.
Which makes sense, given that the ARGO floats found 40% more heat energy in the oceans than we expected, implying that we underestimated the amount of global warming by 40%.
Which explains why the actual level of global warming is about 1.8℃, instead of the 1.2℃ of observed global warming. About 40% higher, as shown in the last IPCC report.

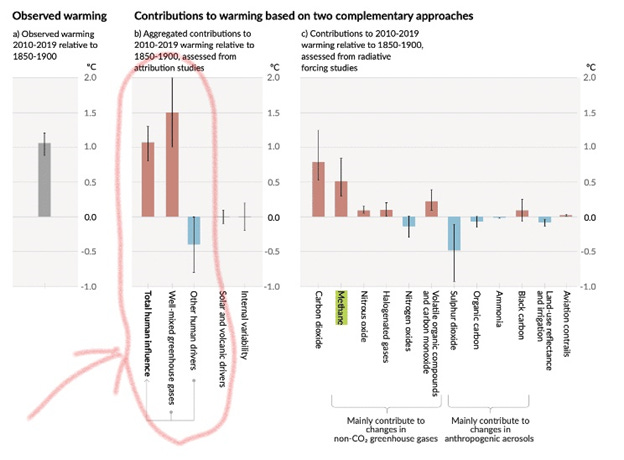
See the grey bar on the far left. The one that says, “Observed Warming”. That’s the 1.2℃ that the GISS, NOAA, and the IPCC are saying is the total amount of global warming since “the late 19th century”.
When the mainstream press says there has been 1.2℃ of warming from increasing levels of CO2 in the atmosphere. That’s the number they are using.
Now look to the right.
The first bar is “Total Human Influence”. It’s equal to the “Observed Warming” bar because they are the same thing. The only thing you can “observe” is the net result of all the human influences on the climate. It’s meaningless fluff, ignore it. The most significant bar is the next one, “Well-mixed greenhouses gases”.
This is the sum of all the warming caused by all the types of greenhouse gases in the atmosphere.
It’s mostly the effect of CO2 and CH4 (Methane) but there are others, including nitrous oxide, VOC, and carbon monoxide. The chart just to the right breaks out what the components of global warming are by gas.
The sum of all these gases is 1.5℃.
That’s what the IPCC is admitting the real total for global warming is now. At a minimum we are already at 1.5℃. Anyone who tells you differently doesn’t understand what this chart says.
This is the minimum amount of global warming since 1850.
This is still too low, the actual amount of global warming since 1850 is probably about 1.8℃. See the black line at the top of the bar.
That “whisker” line is indicating the range of error that the researchers feel goes with the 1.5℃ estimate of the current level of warming. What they are saying is,
“We think there has been 1.5℃ of warming since the late 19th century but it could be as low as 1.1℃ or as high as 2.0℃ “.
Now consider the IPCC’s track record.
They have never “overstated” the amount of warming we are experiencing even once. In fact, they have underestimated the amount of warming and the speed at which it would happen consistently.
Based on this previous history, I think the most realistic estimate of global warming is between 1.5℃ and 2.0℃. Probably around 1.8℃ or 40% higher than the 1.2℃ of “Observed Warming” that our current climate models are in sync with.
That would agree with what climate scientists and the data are saying. We are close to 2.0℃ of warming “right now” and are certainly going to be there before 2050.
Our current Climate Models seem to be underestimating the warming effect of CO2 in the atmosphere by about 40%.
When the first Climate Models were being built in the 60s/70’s. They tried to reduce the scope of their problem by limiting it to the question of “how much will the Earth warm if the CO2 level doubles from the 1850 level of 280ppm?”
Here’s what our best models indicated as of September 2020.
2.6–3.9C — 66%
2.3–4.5C — 95%
2.0–5.7C — 05%
An Assessment of Earth’s Climate Sensitivity Using Multiple Lines of Evidence
Which says,
“there is a 95% chance at CO2 levels of 560ppm that the GMT will increase at least 2.3C and possibly as much as 4.5C, there is a 66% chance that the GMT increase will be between 2.6C and 3.9C”. There is a 05% chance that the GMT could increase as much as 5.7C.”
This is the range of answers after 60 years of effort at modeling the future “near term” climate.
In my last post, (The Crisis Report - 42) I wrote this:
“The Paleoclimate data suggest that the Earth was 4C warmer at a CO2 level of around 400ppm. We are now at 420ppm. In the paleoclimate record,
Going from 400ppm to roughly 550ppm takes us to 6C of warming.
Going from 550ppm to roughly 1000ppm takes us to 9C of warming.
Going from 1000ppm to roughly 2000ppm takes us to about 15C of warming. Which is the hottest the Earth has gotten in the last 500my.
The paleoclimate data indicates that up to 9C of warming is possible at CO2 levels of 1000ppm.
It also indicates that we have already locked in 4C of warming.
The paleoclimate data indicates that we underestimated the Climate sensitivity of the Earth for the 280ppm to 1000ppm CO2 range. That our “worst case” estimate of 5.7C at 560ppm is actually the most likely.”
This paper suggests that those numbers may be as much as 40% too low.
That we seriously underestimated the warming effect of CO2 on the planet.
That we could be going to 6℃ by the end of the century if we do not act RIGHT NOW to try and save our civilization.
We thought we had longer because we have been systematically underestimating the risks at every step of the way.
We are out of time, and it’s getting hotter.
If you have just started following my Climate Articles, here’s a handy reference.
SubStack Index
001 – Greenland Melting and Sea Level Rise.
This is my analysis.
This is what I see.
This is my “Crisis Report”
-rc 05132023
Personal note: I spend over $1200 a year on subscriptions and getting “paywall” access to scientific articles. If you want to help me cover that cost, I will do my best to keep bringing you analysis based on the latest science.


